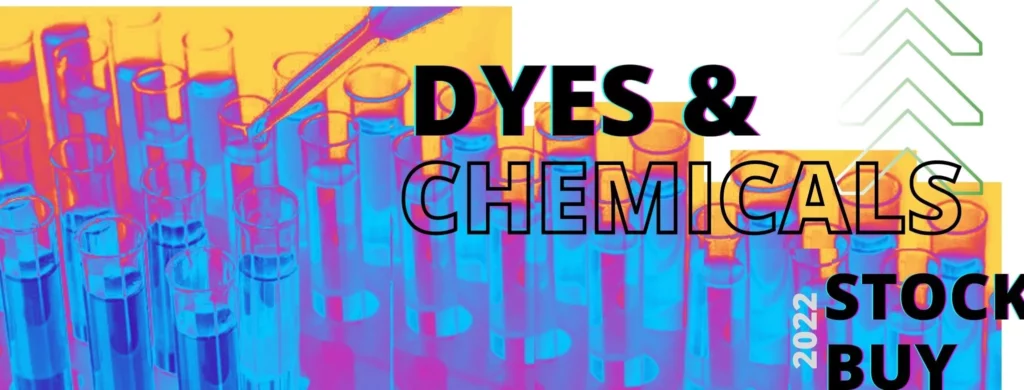
Kiri Industries Limited is engaged in manufacturing dyes, intermediaries and basic chemicals. The current market price is 509 with a MACD crossover on Daily and Weekly. Entry at the same price to get 10 to 15%
Kiri industries has been on the radar for almost 6 months now. The technical on the charts look good. Not getting into the FOMO but this is a buy. The target of the stock is 30 % up at Rs 680.
let’s look at the fundamentals of this stock. Before making a position looking at the technical, one should have a look at the Profit & Loss.
Mar 2011 | Mar 2012 | Mar 2013 | Mar 2014 | Mar 2015 | Mar 2016 | Mar 2017 | Mar 2018 | Mar 2019 | Mar 2020 | Mar 2021 | Mar 2022 | TTM | |
|---|---|---|---|---|---|---|---|---|---|---|---|---|---|
| Sales + | 3,682 | 556 | 554 | 691 | 931 | 1,030 | 1,125 | 1,117 | 1,394 | 1,305 | 957 | 1,497 | 1,481 |
| Expenses + | 3,662 | 475 | 531 | 619 | 831 | 917 | 966 | 936 | 1,163 | 1,119 | 874 | 1,376 | 1,388 |
| Operating Profit | 20 | 81 | 23 | 73 | 100 | 113 | 159 | 181 | 231 | 186 | 83 | 121 | 93 |
| OPM % | 1% | 15% | 4% | 11% | 11% | 11% | 14% | 16% | 17% | 14% | 9% | 8% | 6% |
| Other Income + | 97 | -19 | -110 | -28 | 2 | 17 | 159 | 233 | 9 | 265 | 233 | 2 | 2 |
| Interest | 113 | 54 | 78 | 80 | 86 | 74 | 9 | 3 | 5 | 5 | 4 | 5 | 5 |
| Depreciation | 105 | 32 | 35 | 37 | 28 | 27 | 29 | 34 | 38 | 44 | 46 | 50 | 50 |
| Profit before tax | -102 | -24 | -199 | -72 | -13 | 30 | 279 | 376 | 198 | 402 | 265 | 68 | 40 |
| Tax % | 13% | -33% | -0% | -1% | -22% | 13% | 5% | 5% | 17% | 7% | 5% | 23% | |
| Net Profit | -88 | -32 | -200 | 10 | 182 | 196 | 266 | 358 | 164 | 376 | 252 | 389 | 352 |
| EPS in Rs | -46.40 | -16.84 | -105.02 | 5.22 | 79.88 | 73.71 | 95.40 | 118.38 | 52.36 | 111.69 | 75.10 | 75.00 | 79.68 |
| Dividend Payout % | -3% | -0% | -0% | -0% | -0% | -0% | -0% | -0% | 4% | 0% | -0% | -0% |
This is not a call, it is just for educational purposes. Do your own proper research on this stock. Stock is looking bullish to the naked eye. Kiri Industries is into chemicals and dyes. The stock has been facing a lot of resistance at the 500 price range. While looking at the market, it seems it is about to break that price. Since the market is euphoric and bullish, you may see a breakout.