In a statement made at its board meeting on Friday, Rama Steel Tubes announced a 4:1 bonus share issuance.
According to the company’s press statement, the bonus share issue will include the issuance of shares worth Rs 42.10 crore.According to the company’s filing, “Bonus shares will be issued out of credit of the share premium account of the Company available as of audited financial statements as of September 30, 2022.”
According to the business, bonus shares will be credited to investors by January 18, 2023, or within two months of the date of board approval. With a year-to-date return of 158% and a one-year return of 255%, Rama Steel Tubes is a multibagger investment.
Let us look at the Fundamentals of the company
Profit & Loss
Consolidated Figures in Rs. Crores / View StandalonePRODUCT SEGMENTS
Mar 2015
Mar 2016
Mar 2017
Mar 2018
Mar 2019
Mar 2020
Mar 2021
Mar 2022
TTM
Sales +
192
242
260
377
504
353
470
768
1,189
Expenses +
187
227
240
354
488
344
452
726
1,150
Operating Profit
6
15
20
22
16
9
18
42
39
OPM %
3%
6%
8%
6%
3%
2%
4%
5%
3%
Other Income +
3
3
4
5
5
6
8
9
13
Interest
5
6
8
6
9
10
8
11
17
Depreciation
2
3
3
2
3
3
3
4
5
Profit before tax
1
9
13
18
9
2
15
36
31
Tax %
22%
30%
28%
31%
11%
80%
16%
24%
Net Profit
1
6
9
13
8
0
12
27
25
EPS in Rs
0.02
0.16
0.24
0.30
0.20
0.01
0.29
0.65
0.55
Dividend Payout %
0%
0%
0%
0%
0%
0%
0%
3%
Compounded Sales Growth
10 Years:
%
5 Years:
24%
3 Years:
15%
TTM:
81%
Compounded Profit Growth
10 Years:
%
5 Years:
24%
3 Years:
48%
TTM:
-12%
Stock Price CAGR
10 Years:
%
5 Years:
31%
3 Years:
227%
1 Year:
117%
Return on Equity
10 Years:
%
5 Years:
14%
3 Years:
14%
Last Year:
24%
Balance Sheet
Consolidated Figures in Rs. Crores / View StandaloneCORPORATE ACTIONS
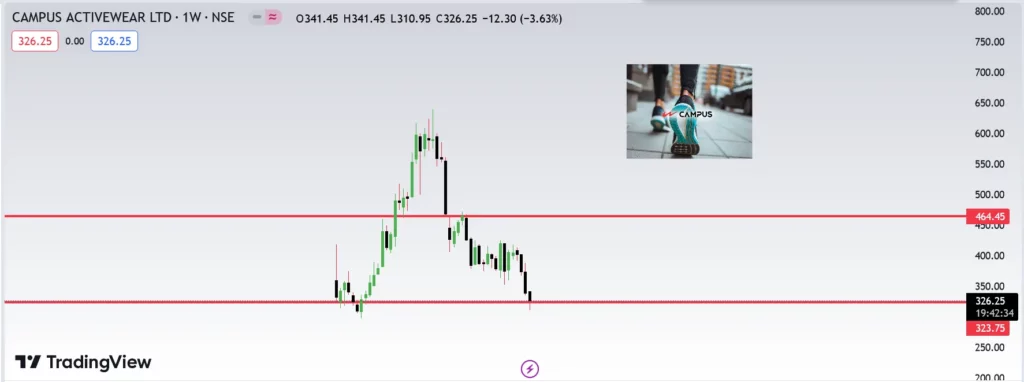
In response to allegations that American alternative asset management firm TPG Global may have sold a 7.6% stake in the sports shoemaker, shares of Campus Activewear fell more than 8% to Rs 337.5 in Friday’s BSE trading. The block deal’s floor price was fixed at Rs 345 per share, or around 7% less than the previous closing price. According to reports, JM Financial is the deal’s only book-running manager. We suggest one can start buying campus above 340.
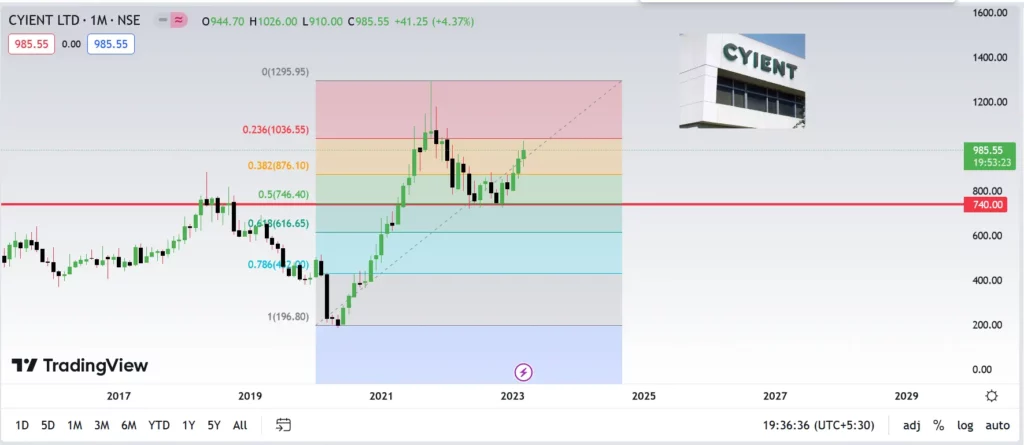
Cyient got a buy signal from HDFC Securities with a target price of Rs 1030. Cyient Ltd. is currently valued at Rs 961.9 on the open market.
A Mid Cap business with a market cap of Rs 10817.57 Crore, Cyient Ltd. was established in 1991 and works in the IT Software industry.Financials For the three months that concluded on December 31, 2022, the firm recorded consolidated total income of Rs 1645.70 crore, up 36.52% from the same period last year and up 16.23% from the previous quarter’s total income of Rs 1415.90 crore. In the most recent quarter, the company generated a net profit after tax of Rs. 156.00 Crore.
Let us look at the Fundamentals
Profit & Loss
Consolidated Figures in Rs. Crores / View StandalonePRODUCT SEGMENTS
Mar 2011
Mar 2012
Mar 2013
Mar 2014
Mar 2015
Mar 2016
Mar 2017
Mar 2018
Mar 2019
Mar 2020
Mar 2021
Mar 2022
TTM
Sales +
1,188
1,553
1,873
2,206
2,736
3,094
3,586
3,914
4,618
4,427
4,132
4,534
5,446
Expenses +
1,008
1,284
1,531
1,796
2,335
2,680
3,109
3,394
3,985
3,881
3,557
3,717
4,552
Operating Profit
180
269
342
410
401
414
477
520
633
546
575
818
894
OPM %
15%
17%
18%
19%
15%
13%
13%
13%
14%
12%
14%
18%
16%
Other Income +
29
16
36
17
122
112
79
147
131
158
140
112
100
Interest
1
1
0
1
6
16
17
20
33
49
43
39
84
Depreciation
49
49
64
72
71
89
95
105
111
188
194
192
227
Profit before tax
160
235
315
354
446
421
444
541
620
468
477
698
682
Tax %
17%
36%
31%
29%
25%
24%
24%
26%
23%
27%
24%
25%
Net Profit
140
161
231
266
351
320
340
403
477
341
364
522
505
EPS in Rs
12.55
14.48
20.70
23.76
31.43
28.94
30.54
36.00
42.33
31.14
33.06
47.35
45.78
Dividend Payout %
10%
17%
22%
21%
25%
24%
34%
36%
35%
48%
51%
51%
Compounded Sales Growth
10 Years:
11%
5 Years:
5%
3 Years:
-1%
TTM:
22%
Compounded Profit Growth
10 Years:
12%
5 Years:
8%
3 Years:
3%
TTM:
11%
Stock Price CAGR
10 Years:
19%
5 Years:
7%
3 Years:
66%
1 Year:
8%
Return on Equity
10 Years:
17%
5 Years:
16%
3 Years:
15%
Last Year:
17%
Balance Sheet
Consolidated Figures in Rs. Crores / View StandaloneCORPORATE ACTIONS
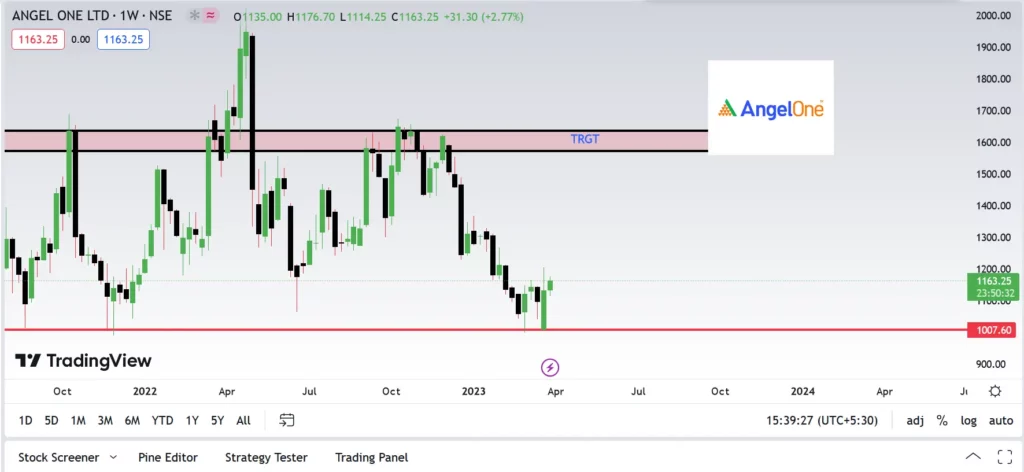
The board of directors of retail brokerage firm Angel One Ltd. approved a fourth interim dividend of 9.60 per equity share for the fiscal year 2022–2023, sending the company’s stock up more than 3% on Wednesday. During midday trading, the stock was up 3.28 percent, trading at 1,127.65 per share. The record date for determining whether stockholders are eligible to receive the aforementioned interim dividend is March 31, 2023.
The members whose names appear on the Register of Members or in depositories’ records as beneficial owners of the shares as of Friday, March 31, 2023, will receive the dividend on or before April 20, 2023, according to Angel One.
Let us look at the Fundamentals
Profit & Loss
Consolidated Figures in Rs. Crores / View StandalonePRODUCT SEGMENTS
Mar 2015
Mar 2016
Mar 2017
Mar 2018
Mar 2019
Mar 2020
Mar 2021
Mar 2022
TTM
Sales +
450
451
440
770
778
748
1,289
2,292
2,776
Expenses +
339
362
437
516
575
564
826
1,374
1,655
Operating Profit
112
90
3
254
203
183
462
918
1,121
OPM %
25%
20%
1%
33%
26%
24%
36%
40%
40%
Other Income +
11
11
112
14
11
2
8
13
99
Interest
38
36
54
95
70
50
42
76
89
Depreciation
10
13
14
15
20
21
18
19
27
Profit before tax
74
52
48
159
124
114
410
836
1,104
Tax %
37%
39%
35%
32%
36%
28%
28%
25%
Net Profit
47
32
31
108
80
82
297
625
828
EPS in Rs
32.69
22.08
21.59
14.99
11.09
11.44
36.28
75.41
99.53
Dividend Payout %
13%
25%
31%
91%
24%
24%
35%
36%
Compounded Sales Growth
10 Years:
%
5 Years:
39%
3 Years:
43%
TTM:
39%
Compounded Profit Growth
10 Years:
%
5 Years:
82%
3 Years:
99%
TTM:
59%
Stock Price CAGR
10 Years:
%
5 Years:
%
3 Years:
%
1 Year:
-24%
Return on Equity
10 Years:
%
5 Years:
32%
3 Years:
36%
Last Year:
46%
Balance Sheet
Consolidated Figures in Rs. Crores / View StandaloneCORPORATE ACTIONS
IEX Share Price: On Monday, shares of Indian Energy Exchange, NSE: IEX, continued to lose money for the seventh session in a row. The stock started off in the green but gave in to selling pressure and turned red amid rumours that the Dalmia Group could reduce its shareholding.
The stock has crashed 11.63 per cent in the last seven sessions, eroding the wealth of investors. IEX shares are trading under pressure since 2:1 bonus issued on December 3, 2021. The scrip has tumbled 41 per cent in the last one year as against 0.81 per cent decline in Nifty50. IEX is India’s premier energy marketplace, providing a nationwide automated trading platform for the physical delivery of electricity, renewables and certificates.
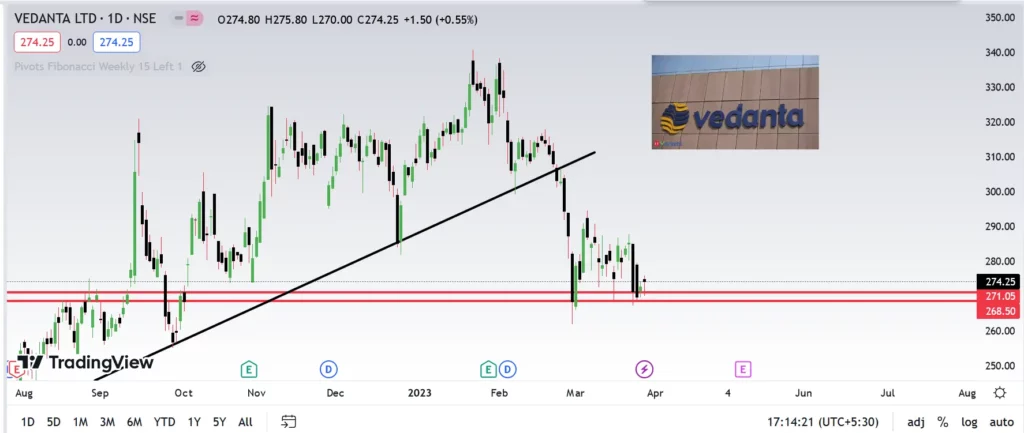
Vedanta Ltd., incorporated in the year 1965, is a Large Cap company (having a market cap of Rs 101,386.60 Crore) operating in Diversified sector.Vedanta stock is currently at its support but we suggest to wait till it cross 280 level for buy.
As we can see here bajaj finserv is standing at its support but still it has not showed any bullish sign so i would suggest to wait till it go above Rs1260
Latest News About Bajaj FinServ
Bajaj Finance Ltd. and Cathay Financial Holding Co. are among the firms considering bids for Commonwealth Bank of Australia’s business in Indonesia, people familiar with the matter said.
The Indian and Taiwanese companies have had talks with advisers about potential offers for PT Bank Commonwealth, the people said. Other companies in the industry could bid for the business, the people said. A sale could value the business at several hundred million dollars
Let us look at the Fundamentals
Profit & Loss
Consolidated Figures in Rs. Crores / View StandalonePRODUCT SEGMENTS
Mar 2011
Mar 2012
Mar 2013
Mar 2014
Mar 2015
Mar 2016
Mar 2017
Mar 2018
Mar 2019
Mar 2020
Mar 2021
Mar 2022
TTM
Sales +
2,415
2,715
8,055
6,023
11,335
20,533
24,507
32,862
42,605
54,351
60,592
68,406
77,308
Expenses +
615
920
4,124
1,531
5,823
13,795
15,794
22,074
27,569
36,094
40,950
46,951
49,682
Operating Profit
1,800
1,794
3,931
4,491
5,511
6,739
8,713
10,788
15,037
18,258
19,641
21,455
27,626
OPM %
75%
66%
49%
75%
49%
33%
36%
33%
35%
34%
32%
31%
36%
Other Income +
168
1,190
2
3
8
0
0
1
2
0
-7
8
0
Interest
301
744
1,204
1,562
2,230
2,877
3,716
4,531
6,657
9,500
9,274
9,629
11,247
Depreciation
19
14
22
31
38
58
73
160
226
457
498
563
647
Profit before tax
1,649
2,226
2,708
2,902
3,251
3,804
4,925
6,099
8,155
8,302
9,862
11,271
15,733
Tax %
11%
15%
18%
24%
26%
27%
30%
32%
34%
28%
25%
26%
Net Profit
1,492
1,890
2,214
2,191
2,409
2,775
3,450
4,176
5,374
5,994
7,367
8,314
11,408
EPS in Rs
7.00
8.40
9.89
9.71
10.62
11.71
14.21
16.65
20.23
21.17
28.09
28.63
37.65
Dividend Payout %
2%
2%
2%
2%
2%
1%
1%
1%
1%
2%
1%
1%
Compounded Sales Growth
10 Years:
38%
5 Years:
23%
3 Years:
17%
TTM:
19%
Compounded Profit Growth
10 Years:
13%
5 Years:
15%
3 Years:
12%
TTM:
43%
Stock Price CAGR
10 Years:
32%
5 Years:
19%
3 Years:
37%
1 Year:
-24%
Return on Equity
10 Years:
14%
5 Years:
13%
3 Years:
13%
Last Year:
12%
Balance Sheet
Consolidated Figures in Rs. Crores / View StandaloneCORPORATE ACTIONS
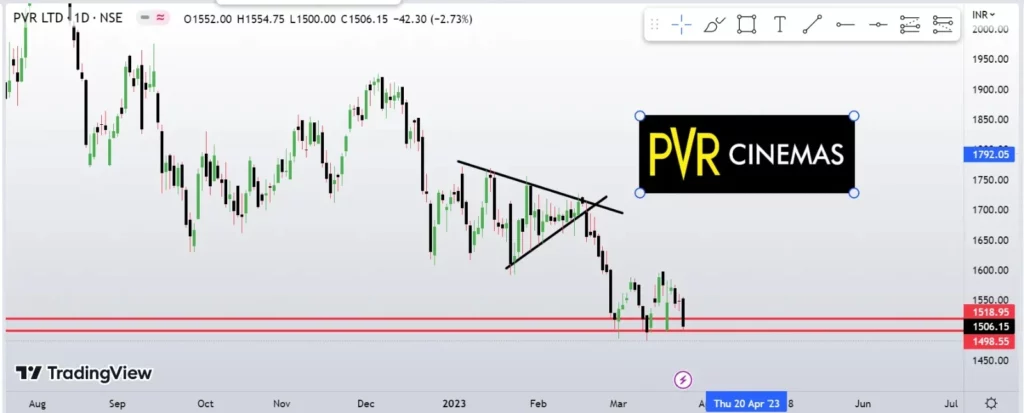
PVR is opening 11 screen multiplex in Chennai .As you all can see the stock it at its support right now around 1500 so we can start taking entry from here.
Let us look at the fundamental of the stocks
Quarterly Results
Consolidated Figures in Rs. Crores / View Standalone PRODUCT SEGMENTS
Dec 2019
Mar 2020
Jun 2020
Sep 2020
Dec 2020
Mar 2021
Jun 2021
Sep 2021
Dec 2021
Mar 2022
Jun 2022
Sep 2022
Dec 2022
Sales +
916
645
13
40
45
181
59
120
614
537
981
687
941
Expenses +
609
473
129
125
124
238
150
188
449
437
640
533
652
Operating Profit
307
173
-116
-85
-78
-57
-91
-68
165
100
342
154
289
OPM %
34%
27%
-914%
-209%
-172%
-31%
-153%
-57%
27%
19%
35%
22%
31%
Other Income +
8
17
43
70
275
82
33
155
96
43
21
16
20
Interest
122
117
124
123
127
124
124
124
126
125
128
128
127
Depreciation
135
142
145
142
142
146
143
149
154
169
149
153
155
Profit before tax
58
-70
-342
-279
-73
-245
-325
-185
-19
-152
85
-110
26
Tax %
38%
-6%
34%
34%
33%
-18%
32%
17%
47%
30%
38%
35%
39%
Net Profit
36
-75
-226
-184
-49
-289
-220
-153
-10
-105
53
-71
16
EPS in Rs
6.58
-13.49
-40.87
-31.02
-8.28
-47.58
-36.11
-25.17
-1.67
-17.29
8.74
-11.65
2.64
Raw PDF
Balance Sheet
Consolidated Figures in Rs. Crores / View StandaloneCORPORATE ACTIONS
Mar 2011
Mar 2012
Mar 2013
Mar 2014
Mar 2015
Mar 2016
Mar 2017
Mar 2018
Mar 2019
Mar 2020
Mar 2021
Mar 2022
Sep 2022
Share Capital +
27
26
40
41
42
47
47
47
47
51
61
61
61
Reserves
314
257
603
358
368
835
918
1,029
1,449
1,429
1,773
1,309
1,318
Borrowings +
162
203
657
613
747
660
820
831
1,282
5,066
5,003
5,196
5,291
Other Liabilities +
153
126
287
340
273
356
440
442
1,062
881
665
757
646
Total Liabilities
656
613
1,586
1,352
1,429
1,897
2,225
2,348
3,840
7,428
7,502
7,323
7,316
Fixed Assets +
368
273
996
820
860
1,000
1,509
1,590
2,742
5,886
5,475
5,407
5,360
CWIP
58
88
145
107
80
76
106
102
221
155
217
64
104
Investments
1
1
38
24
2
2
2
21
11
2
1
0
0
Other Assets +
230
252
407
402
486
820
609
636
866
1,385
1,808
1,851
1,852
Total Assets
656
613
1,586
1,352
1,429
1,897
2,225
2,348
3,840
7,428
7,502
7,323
7,316
Balance sheet of PVR stock 2023
After analysis of this stock, we understand that the stock has been continuously falling from its all time high price. In any scenario, until this stock finds its rock hard support, we should not take an entry till then. Our recommended price to take entry in this PVR stock is Rs 1410. CMP of this stock is Rs 1506 a share.