What are Chart Patterns
Stock chart patterns often signal transitions between rising and falling trends. A price pattern is a recognizable configuration of price movement identified using a series of trendlines and/or curves.
When a price pattern signals a change in trend direction, it is known as a reversal pattern; a continuation pattern occurs when the trend continues in its existing direction following a brief pause. There are many patterns used by traders.
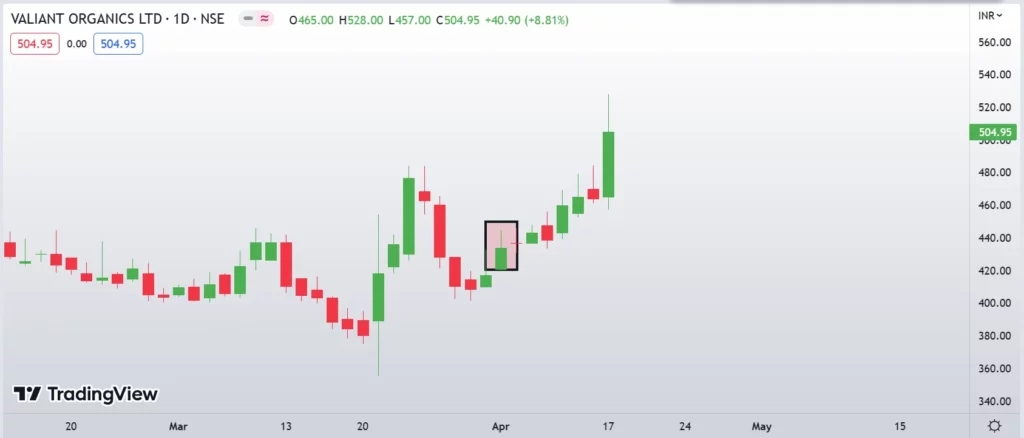
Hammer
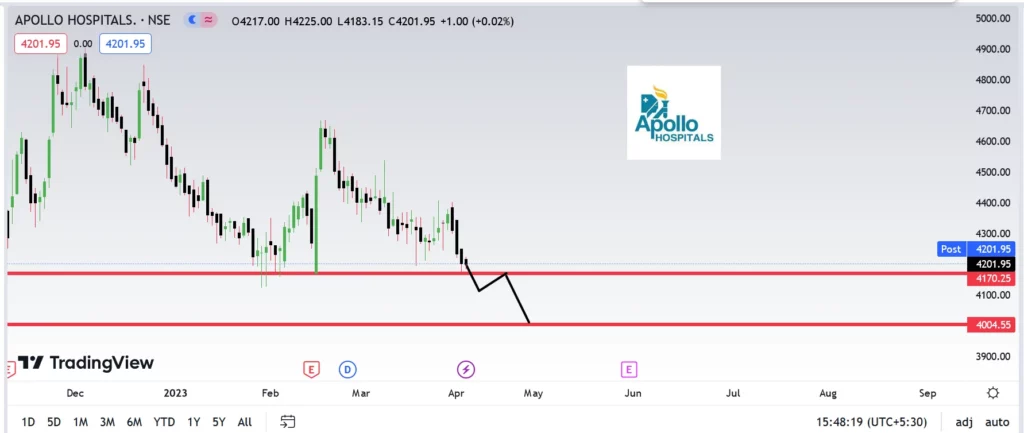
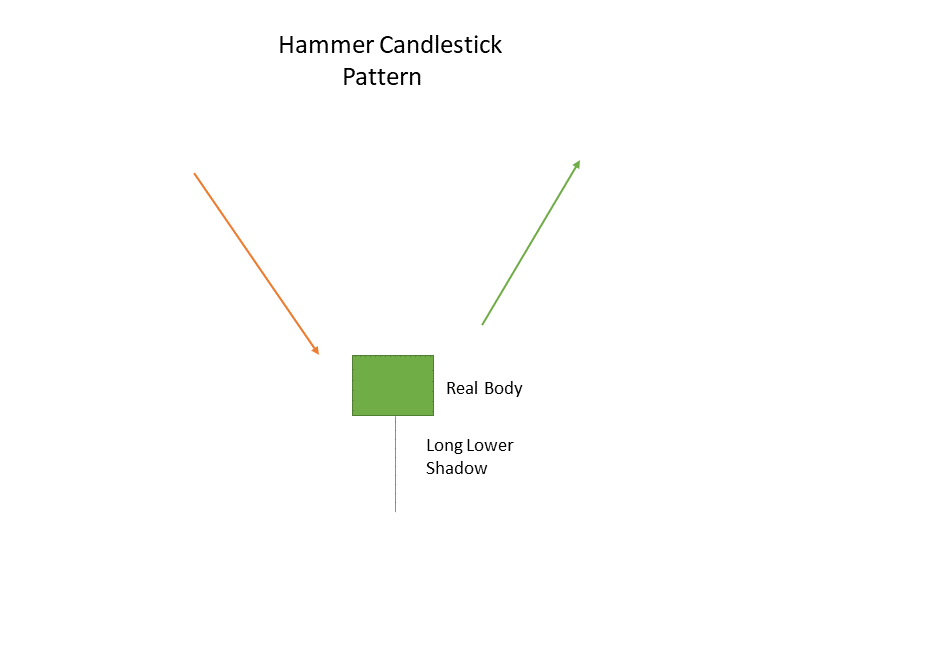
At the end of a downtrend, the single candlestick pattern known as a hammer is formed, which denotes a bullish turn.
This candle’s genuine body, which is little and near the top, has a lower shadow that ought to be twice as large. There is minimal to no top shadow in this candlestick chart pattern.
The psychological explanation for this candle formation is that as soon as prices opened, sellers pushed them lower.
As soon as buyers entered the market, prices shot up and the trading session ended with prices higher than they had started.
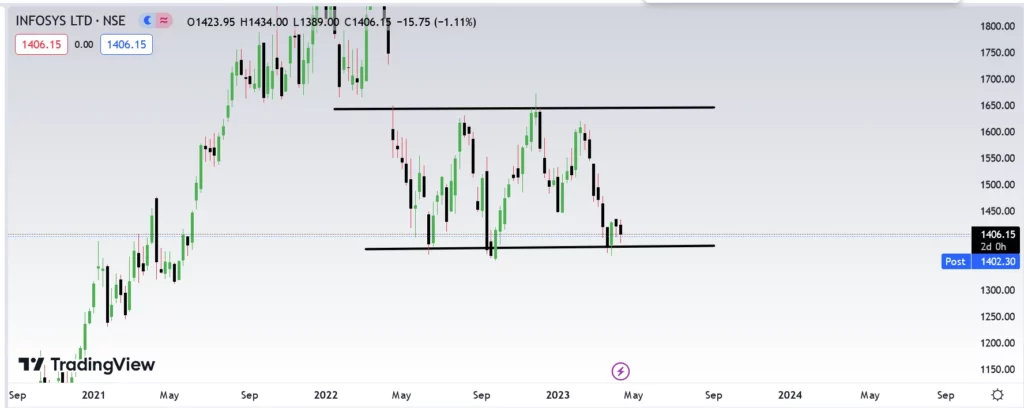
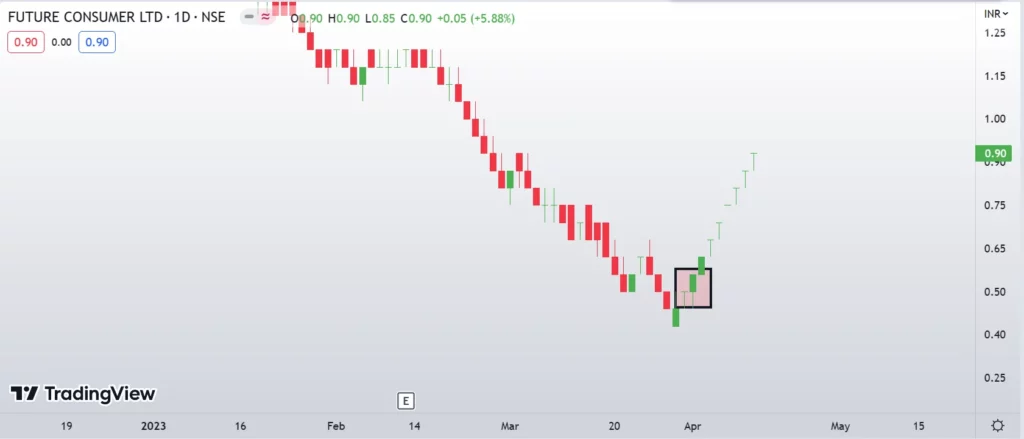
Example:
Inverted Hammer
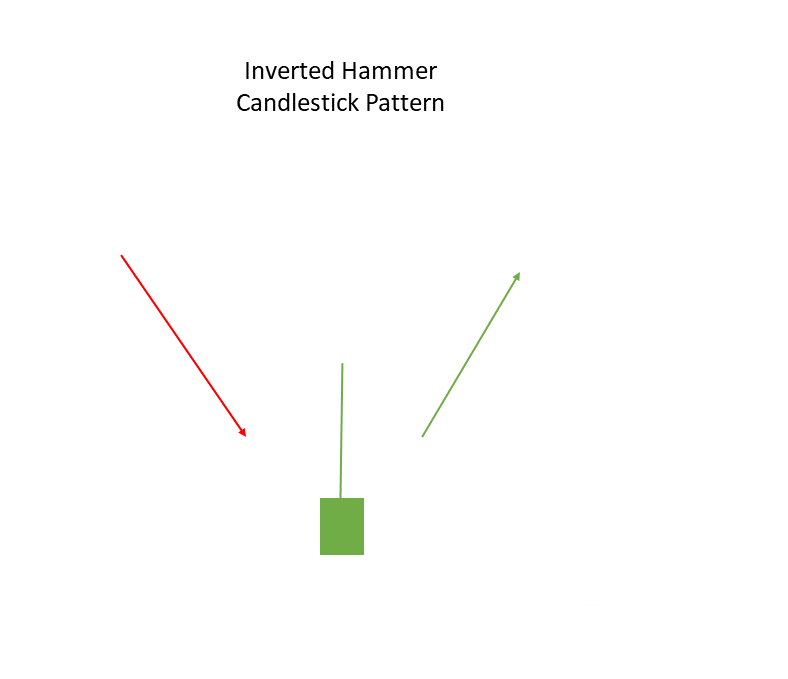
At the bottom of the downtrend, an Inverted Hammer forms, signaling a bullish reversal.
The actual body of this candlestick is at the very end, and its upper shadow is quite long. The Hammer Candlestick pattern is the opposite of this motif.
When the starting and closing prices are close to one another and the upper shadow is greater than double the true body, this pattern is generated.
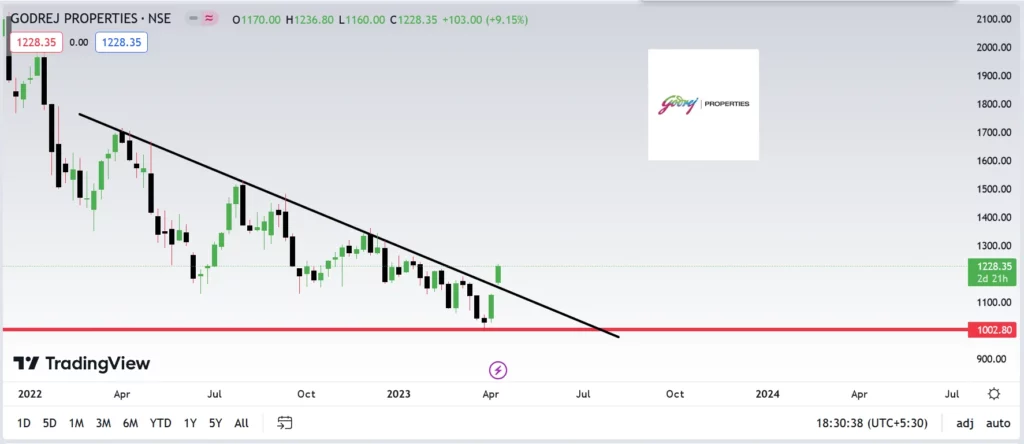
Example:
Disclaimer : The information mentioned above is merely an opinion and should only be treated for educational purposes. If you have any questions or feedback about this article, you can write us back. To reach out, you can use our contact us page Support@learningsharks.in