Learning sharks-Share Market Institute


Rajouri Garden  8595071711 7982037049  Noida 8920210950 , and  Paschim Vihar  7827445731  

Fee revision notice effective 1st April 2025; No change for students enrolled before 15th May 2025

Download “Key features of Budget 2024-2025here

Bajaj Finance shares crash: Investors in a fix! Is the stock headed toward Rs 5,000 mark?

Shares of Bajaj Finance decreased 1.95%, or Rs 119.25, to close at Rs 5,980.60 on the BSE today. Shares of Bajaj Finance decreased 2.6% during the day to Rs 5,941 level. After six months, the Bajaj Finance stock has now fallen below the Rs. 6,000 threshold following today’s downturn. (July 18, 2022).

Bajaj Finance’s stock is now trading 25% below its January 19, 2022 52-week high of Rs. 8043.50. On the other side, on June 17, 2022, the price of Bajaj Finance stock fell to a 52-week low of Rs. 5,235.60.

Investors in Bajaj Finance are in a pickle as the NBFC company has lost about Rs 33,500 crore in market cap over the past two days due to a correction. Bajaj Finance announced weaker-than-expected AUM (Assets Under Management) growth for the December quarter, which caused shares to conclude the day 7.2% lower at Rs 6,099.85.

After the NBFC announced lower-than-expected AUMs (Assets Under Management) growth in the December quarter, shares of Bajaj Finance dropped 7.2% to Rs 6,099.85 on Thursday.Bajaj Finance shares lost another 2.6% intraday to Rs 5,941 mark on Friday, continuing their downward trend. The Bajaj Finance stock has dropped below Rs 6,000 for the first time in six months with today’s fall. (July 18, 2022).

With a sell rating and a target of Rs 5,800, Kotak Institutional Equities is even more pessimistic on the company. Jefferies has a hold rating and a target price of Rs 8,160, on the other hand. Over 9% of the stock’s value has been lost in only two sessions, and it has lost 22.81% of its value over the past year.

Jigar S Patel, Senior Manager- Technical Research Analyst – “Since last four months, the said counter has been making lower highs and lower lows structure, which resulted in a 22% cut in price,” according to Anand Rathi Shares and Stock Brokers. Massive volume and a beating of almost 10% were seen in the last two trading sessions, indicating that the fall is still ongoing. The next reliable support can be found between Rs. 5600 and Rs. 5700, where one can start a new long.

The daily MACD has produced a bearish cross below the zero line, suggesting that there will be more weakening in the sessions to come.

Sneha Seth, “Considering the recent price action, undoubtedly the trend is strong bearish, but looking at the bigger picture, it’s not advisable to exit after 20% price decline from recent high,” stated Angel One Ltd.’s derivatives research analyst.

It would be fascinating to watch how this stock reacts around its cluster of support, which is Rs 6,000-5,800, for traders.

A R Ramachandran The stock is beginning to enter oversold territory, and short sellers are urged to book profits at current levels, according to a statement from Tips2trades.

Akshay Ashok – “Although AUM growth in the business update was slightly below expectations, customer acquisition momentum remains intact, and the company is on track to achieve target of acquiring 10-11 million customers in 2023,” said research analyst Prabhudas Lilladher. Increased stickiness of new to franchise customers (NTF) will contribute to incremental portfolio growth in the upcoming quarters.

Rahul Malani, According to the Banking & NBFC, Fundamental Research, Sharekhan analyst of BNP Paribas, “Bajaj Finance announced its Q3FY23 business updates wherein AUM growth was stated as 27% YoY/6% QoQ vs. 31% YoY/7% QoQ in Q2FY23.

If we go back to pre-covid era, BAF recorded an AUM growth rate of about 37% CAGR over the previous ten years. It was the lender with the fastest growth rate, and growth differences from banks and other NBFCs were also significant.

BAF has been reporting 25–30% increase in AUM during the post-pandemic period, and growth differentials have also decreased as a result of banks and other NBFCs’ and banks’ acceleration of loan growth.

As new companies (Jio Fin) and established fintech players (such as BAF) enter the consumer market that BAF serves, concerns have also been raised about intense rivalry developing in the future. It is currently trading for 6.4 times the book value for the next year.

Regarding the long-term investment thesis, we still believe that BAF is well-positioned to deliver strong, industry-leading ROA/ROE of 4.7%/ 4.8% 22%/33% in FY24E/FY25E thanks to its franchise built around strong competitive moats that are hard to replicate as well as strong execution capabilities, underwriting, and data analytics. We continue to be optimistic about the franchise’s future success and high earnings growth.

Profitability Ratios: What They Are, Common Types, and How Businesses Use Them

What Are Profitability Ratios?

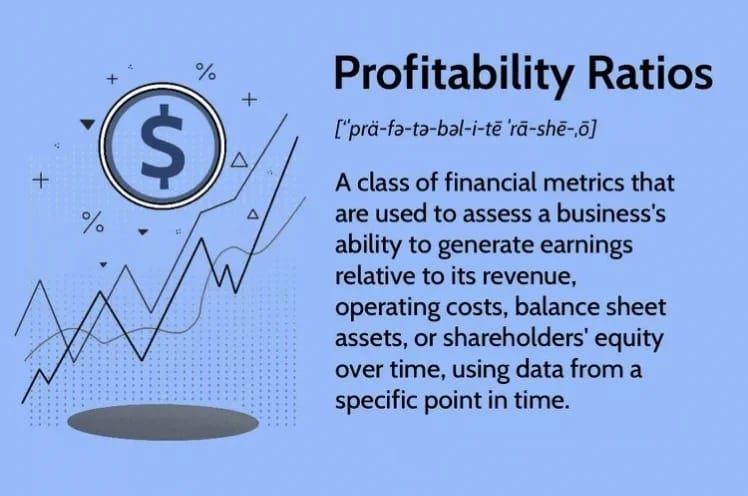
A family of financial indicators known as profitability ratios is used to evaluate a company’s potential to create profits over time in relation to its revenue, operational expenses, balance sheet assets, or shareholders’ equity using information from a particular point in time. These indicators are some of the most widely used in financial analysis.

Efficiency ratios, which take into account how well a company uses its resources internally to generate income, can be used in conjunction with profitability ratios. (as opposed to after-cost profits).

KEY TAKEAWAYS

  • A company’s capacity to generate profits from sales or activities, balance sheet assets, or shareholders’ equity is evaluated by profitability ratios.
  • Higher ratios, which show success in turning revenue to profit, are frequently preferable than lower ratios.
  • Margin and return ratios are examples of profitability ratios.

What Can Profitability Ratios Tell You?

In general, larger profitability ratios might indicate a company’s strengths and advantages, such as the capacity to charge more (or less) for items and to keep expenses down.

The most helpful comparisons for a company’s profitability ratios are those with similar businesses, the company’s past performance, or industry averages.

Margin Ratios

The difference between profit and costs grows while costs are low and contracts when more costs (such as taxes, operational expenditures, and cost of goods sold (COGS)) are taken into account.

Gross Margin

The difference between sales income and the previously mentioned COGS, or costs of goods sold, is the gross profit.

It can mean the business has a significant competitive edge.

Therefore, comparing a retailer’s fourth-quarter profit margin to its (or its peers’) fourth-quarter profit margin from the prior year would be the most insightful and helpful.

Operating Margin

How effectively a business handles its operations can be shown by operating margin. That can reveal how well management minimises expenses and increases profitability.

It most likely has lower prices than its rivals. Additionally, it is better equipped to withstand the effects of an economy in decline.

Pretax Margin

The pretax margin displays a company’s profitability after deducting all costs, except taxes and non-operating costs like interest and inventory write-offs.

When compared to its competitors, a company with a large pretax profit margin can be said to be financially sound and capable of setting the most reasonable prices for its goods and/or services.

Net Profit Margin

The net profit margin is used as a proxy for a company’s overall financial health. It can show whether management of the company is making a sufficient profit from sales and keeping all costs in check.

The similar one-off transactions won’t happen at other companies. Because of this, it’s a good idea to include other ratios in addition to net profit margin, like gross margin and operating margin.

As a peer comparison tool, it is limited by the fact that because it takes into account all costs, it can show one-time costs or the sale of assets that increased profits for a specific time frame.

What Are the Most Important Profitability Ratios?

Gross margin, operating margin, and net profit margin are frequently seen as the profitability measures that are most significant for a corporation.

Why Are Profitability Ratios Significant?

They are important because they can show a company’s capacity to generate consistent profits (after deducting expenditures) and how effectively it manages investments to generate returns for shareholders. They may demonstrate the management’s success in achieving these two objectives as well as the overall monetary health of the business.

How Is Business Profitability Best Measured?

Two often used metrics for gauging firm success are the gross profit margin and net profit margin ratios. The net profit margin measures the profit a company makes as a percentage of its total sales after all costs have been deducted. A higher profit than the cost of products sold is referred to as a higher gross profit margin.

How to Buy and Sell ETFs

Once you get the fundamentals down, learning how to purchase and sell exchange-traded funds (ETFs) is a piece of cake. We explore a few different facets of the procedure and respond to inquiries regarding ETF accounts, the duration of holding an ETF prior to sale, and if it is possible to buy and sell an ETF on the same day.

Where to Buy ETFs

During the course of the trading day, ETFs are bought and sold. You may purchase ETFs through any online broker, just like stocks, so be sure to thoroughly investigate the brokerage account you intend to use before deciding which one is best for you.

DO I NEED A SPECIAL ETF ACCOUNT?

Without the requirement for a specific ETF account or additional order costs, you can buy and sell ETFs at a reasonable price using an online brokerage account.

Mutual fund shares, on the other hand, are not listed on stock exchanges. Instead, investors purchase and sell mutual funds through a range of distribution channels, including through investment professionals (full-service brokers, independent financial planners, representatives of banks or savings institutions, or insurance agents), as well as directly from fund companies.

DO YOU NEED TO HAVE A MINIMUM AMOUNT TO BUY ETFS?

In the past, the cost of one share plus any applicable charges and fees was the minimum an investor had to pay to purchase an ETF; however, make sure your broker permits fractional share purchases of the ETF you’re interested in. ETFs typically cost a lot less than mutual funds.

Buying ETFs in a Few Easy Steps

However, there are a few simple measures you can take to ensure you make wise selections before you start buying ETFs and adding them to your portfolio.

OPEN YOUR ACCOUNT TO BUY AND SELL AN ETF

You can open a joint account or an individual account if you want to buy ETFs for general investing. Select a reliable brokerage company with helpful customer service and technical support in case any problems occur or you have inquiries regarding your investments.

At this point, you should also choose whether you want to handle the management of your ETF portfolio yourself or hire a professional to do it.

RESEARCH ETFS YOU ARE INTERESTED IN

Doing your homework is one of the most crucial aspects in buying an ETF. Before making an investment, make sure you comprehend all the details of your fund, including:

  • whether the ETF is actively or passively managed; who manages the ETF;
  • previous performance;
  • ratio of costs;
  • if it does, what index does it follow? and
  • Related charges.

To keep track of the ETFs you might want to buy, use My Portfolio on AAII.

How Long Should You Hold an ETF?

For long-term investors, ETFs can be excellent building bricks, but it’s crucial to understand how long you should hold them and when you might want to sell. ETF investments can offer investors a number of advantages, including wide exposure to many industries and sectors as well as assistance in lowering overall portfolio risk.

Long-term investors might keep an ETF that meets their needs for decades in a perfect world, especially if their objective is to fund retirement. You’ll be able to determine how long you should keep an ETF before selling it, though, based on your monitoring strategy.

WHEN SHOULD YOU SELL AN ETF?

Since your unique goals, risk tolerance, and allocation should be taken into account, there is no general rule for when to sell an ETF. Selling an ETF, however, is never a good idea if you:

  • beginning to experience pressure from abrupt market falls or crashes,
  • Want to liquidate before achieving your goals but need money right away,
  • received unfavourable news recently regarding an ETF without investigating financial measures or prior data points.

Additionally, selecting ETFs with adequate liquidity and trading volume is crucial. This is due to the ease with which one can act rashly and sell an ETF without first confirming its liquidity. Low liquidity could cause the ETF to sell at a share price that is momentarily below market value.

Resources to Make Buying ETFs Even Easier

It’s crucial to understand your options when it comes to buying and selling ETFs, but how can you choose which particular ETFs to include in your portfolio? Members of AAII have access to tools that can be used to identify the best ETFs for their needs.

You can use the A+ Investor ETF+ screener to assist you select ETFs by entering the precise criteria and qualities you are looking for in an ETF.

Blockchain Facts: What Is It, How It Works, and How It …

What Is a Blockchain?

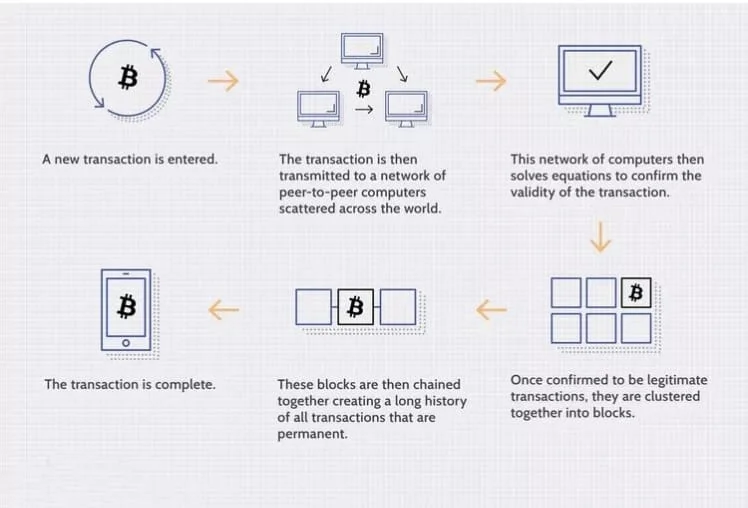
A blockchain is a shared distributed database or ledger between computer network nodes. A blockchain serves as an electronic database for storing data in digital form. The most well-known use of blockchain technology is for preserving a secure and decentralised record of transactions in cryptocurrency systems like Bitcoin.

The way the data is organised in a blockchain differs significantly from how it is typically organised. In a blockchain, data is gathered in groups called blocks that each include sets of data. Every additional piece of information that comes after that newly added block is combined into a brand-new block, which is then added to the chain once it is full.

KEY TAKEAWAYS

  • A blockchain is a particular kind of shared database that varies from other databases in that it saves data in blocks that are subsequently connected via cryptography.
  • A new block is created as each new piece of data arrives. The data is chained together in chronological sequence once the block has been filled with information and is attached to the block before it.
  • Blockchain is utilised in the context of Bitcoin in a decentralised manner, ensuring that no one user or group has power but rather that all users collectively maintain control.

How Does a Blockchain Work?

Blockchain aims to make it possible to share and record digital information without editing it. A blockchain serves as the basis for immutable ledgers, or records of transactions that cannot be changed, removed, or destroyed.

The blockchain concept was first put up as a research project in 1991, long before Bitcoin, which was introduced in 2009.

Transaction Process

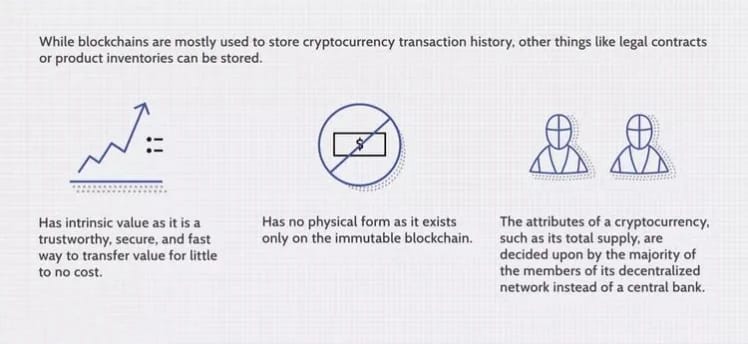
Attributes of Cryptocurrency

Blockchain Decentralization

Consider a business with a server farm of 10,000 machines that it uses to keep a database with all of its clients’ account information. All of these computers are located in a warehouse that belongs to this corporation, and it has complete authority over each of them as well as the data they hold. But this creates a single point of failure.

This approach aids in creating a clear and precise sequence of events. This prevents any one node in the network from changing the data it contains.

Transparency

Because of the decentralized nature of Bitcoin’s blockchain, all transactions can be transparently viewed by either having a personal node or using blockchain explorers that allow anyone to see transactions occurring live.

As an illustration, exchanges have previously been hacked, and anyone who had Bitcoin stored there lost everything. The stolen Bitcoins are clearly identifiable, despite the hacker’s complete anonymity.

Naturally, the data kept on the Bitcoin blockchain (as well as the majority of others) is encrypted.

Is Blockchain Secure?

Decentralized security and trust are made possible by blockchain technology in a number of ways. To start, new blocks are always chronologically and linearly stored. In other words, they are constantly added to the blockchain’s “end.” It is very difficult to go back and change the contents of a block once it has been added to the blockchain unless a majority of the network has agreed to do so.

When everyone compares their copies to one another, they will notice that this one copy stands out, and the hacker’s version of the chain will be rejected as fraudulent.

The requirement to rewrite every block because their timestamps and hash codes had changed would make such an attack extremely expensive and resource-intensive.

Bitcoin vs. Blockchain

Stuart Haber and W. Scott Stornetta, two researchers interested in implementing a system where document timestamps could not be altered, first proposed the concept of blockchain technology in 1991.

On a blockchain, the Bitcoin protocol is constructed. Bitcoin’s anonymous founder, Satoshi Nakamoto, described the digital currency as “a new electronic cash system that’s fully peer-to-peer, with no trusted third party” in a research paper introducing it.

This could take the shape of transactions, votes in elections, goods inventories, state identifications, deeds to properties, and much more, as was previously said.

Blockchain vs. Banks

Blockchain technology has been hailed as a disruptive force for the financial industry, particularly for the payment and banking processes. Banks and decentralised blockchains, however, are very dissimilar.

How Are Blockchains Used?

More than 10,000 additional cryptocurrency systems are currently active on the blockchain. However, it transpires that using a blockchain to store information about other kinds of transactions is also a secure method.

Walmart, Pfizer, AIG, Siemens, Unilever, and numerous more businesses are just a few that have already adopted blockchain technology.

Banking and Finance

Due to the enormous volume of transactions that banks must settle, even if you do make your deposit within business hours, it may still take one to three days for the transaction to be verified. Blockchain, however, is always active.

Given the scale of the amounts involved, even a little period of time during which the money is in transit can be extremely expensive and risky for banks.

How To Understand ‘Price Earnings (P/E) Ratio’

The thoughts and assessments of our editors are theirs alone, regardless of whether Forbes Advisor receives compensation for purchases made through partner links on this page. We provide information about saving money and investing, but we don’t give recommendations or personal advice.

Please seek the advice of a licenced financial adviser if you are unsure if investing is appropriate for you or which investments are suitable for you.

Any conversation about purchasing shares will eventually bring up the price-to-earnings ratio, or P/E ratio. Therefore, what is it and what can it tell us about certain shares, their rivals, and the markets they operate in?

Keep in mind that you run the risk of losing money when you invest. Investment returns can be both positive and negative, and you could not get your money back. You should get financial counsel if you are unclear of the best decision for your specific situation.

What is a P/E ratio?

The P/E ratio is derived by dividing a company’s share price by its profits (net profit) per share. (EPS).

It quantifies the premium that investors are prepared to pay over a company’s present earnings, which reflects the premium that investors are willing to pay over a company’s expected future earnings growth.

Technology companies, meanwhile, have faced major valuation downgrades as US stock markets reach bear market territory, with Tesla currently trading on a P/E ratio of 54. The parent company of Facebook, Meta, too had a similar fate, with its P/E ratio falling from 18 to 9 last year.

Delving deeper

There are two distinct P/E ratio types:

  • The “trailing” or “historic” P/E ratio is based on actual EPS for the previous financial year or the previous twelve months (also known as trailing 12 month earnings).
  • The predicted EPS for the following fiscal year supplied by the company and/or analysts form the basis of the forward P/E ratio.

Or, to put it another way, it would require investors to generate enough money over the course of five years to recoup their initial investment. Investor expectations for minimal earnings growth are implied by this.

A low P/E ratio may signify that investors think there is a high danger that the company won’t reach profits projections. P/E ratios may represent investors’ perceptions of the risk associated with investing in the company.

How to use P/E ratios to value shares

A P/E ratio is relative, which means that it is only useful when compared to the company’s (publicly listed) rivals and the larger stock market.

Let’s examine the various P/E ratios for “growth” and “value” stocks.

  1. What are typical P/E ratios for growth shares?

Investors are willing to pay a premium price for these shares in relation to their existing earnings because they anticipate a strong rate of earnings growth.

Four of the biggest US technology businesses currently have the following trailing P/E ratios:

Share/indexP/E ratioForecast EPS growth (per annum)
Netflix3122%
Apple276%
Meta (Facebook)2419%
Alphabet2320%
Nasdaq 10025n/a
Based on WSJ Markets’ EPS growth forecast for 2022 to 2025

With a P/E ratio of 31, Netflix has the highest ratio among the firms in this group and the Nasdaq 100. However, although selling on significantly lower P/E ratios than Meta and Alphabet, its projected earnings growth is comparable to those companies’.

The company’s EPS also decreased by more than 11% in 2022, which raises the historic P/E ratio; however, the forecasted profits recovery will result in a decline in the forward P/E ratio, lowering it.

The company’s share price and, consequently, the P/E ratio have suffered because its earnings were below forecasts and because of worries about macroeconomic headwinds.

2. What are typical P/E ratios for ‘value’ shares?

In contrast to the growth shares that predominate on the Nasdaq, the FTSE has a higher percentage of value shares. Many of the FTSE firms work in established sectors including mining, energy, finance, and industrial items.

Observe the trailing P/E ratios of a few FTSE 100 companies:

Share/indexP/E ratioForecast EPS growth (per annum)
Tesco215%
Sainsbury’s11-1%
HSBC922%
NatWest810%
FTSE 10014n/a
Based on WSJ Markets’ EPS growth forecast for 2022 to 2025

There is less of an association between the P/E ratio and earnings growth, despite expected earnings growth being marginally lower than the group of four US equities we examined.

The high dividend yield of these FTSE businesses, which ranges from 4 to 5%, is a measure of the income owners will receive relative to the present share price. If demand for the share increases as a result of investors seeking for income, this could potentially have a favourable effect on the share price.

Tesco has a much bigger market share than Sainsbury’s, but selling at a somewhat lower dividend yield, which might assist it to continue making money despite the present cost-of-living crunch. Due of Tesco’s superior fundamentals over Sainsbury’s, investors may be tempted to pay more for Tesco stock.

Why have P/E ratios fallen recently?

Share prices and P/E ratios are significantly influenced by investor sentiment. Over the past 18 months, concerns about high inflation, increasing interest rates, and geopolitical unpredictability have had a negative impact on valuations.

But throughout the same time span, the P/E ratio of the FTSE 100 has remained stable at roughly 13 to 15, largely because it has a bigger percentage of value companies. Investors frequently convert from growth to value shares during a recession because the latter are more resilient due to their more defensive attributes.

What are the limitations of the P/E ratio?

When considering an investment, investors should also take other financial indicators like profit margin, dividend yield, cash flow, and net debt into account.

It’s also important to consider the following P/E ratio restrictions:

  • The P/E ratio can be significantly impacted by various EPS measurements, such as trailing or forward EPS, or adjusted EPS to take one-off things out. Additionally, EPS is a snapshot at a specific moment and might not be an accurate representation of average earnings.
  • The funding structure of a corporation is not sufficiently reflected by the EPS. Due to interest payments, a business with more debt could have lower EPS. If the money is put into the business, however, debt may actually increase future earnings growth.
  • Forward P/E ratios are less reliable if a firm doesn’t achieve its EPS projections.

Should you buy shares with a low P/E ratio?

It’s easy to consider businesses with a high P/E ratio to be “overvalued.” However, if that business generates large earnings growth, which raises the share price, then its greater valuation is justified.

Similar to this, a business with a low P/E ratio may have potential share price appreciation if it has faster-than-anticipated earnings growth. Or its dividend yield may draw in investors, driving up the price of the stock as a result of the increased demand for dividend-paying stocks.

The company may, however, be selling at a low P/E ratio for good reason, such as because it is experiencing financial difficulties or is in a sector that is cyclical and is going to experience a downturn.


What Are Equity Shares?

Equity Share Meaning

One of the most popular ways for people to invest in the stock market is through equity shares. Equity shares are popular among investors who want to profit from the historically strong returns that equities have provided.

The BSE Sensex Index experienced compounded yearly growth of 11.12% within the same time period. This suggests that a 5,000 INR investment in the BSE Sensex in 2011 would have been worth 14,350 INR in 2020.

What Is A Share?

A share represents a portion of ownership in a business. The initial capital needed to start a business is provided by partners or investors who also own the business. The company needs more financing as it expands. The business has a number of options for raising funds, including engaging new investors, adding partners, and taking out business loans.

Issuing shares, also referred to as going public or conducting an initial public offering, is the most typical and favoured method of raising cash for businesses (IPO). Investors are given the option to trade these shares on major exchanges including the Bombay Stock Exchange and the National Stock Exchange (NSE) (BSE).

As a shareholder, the investor is also eligible to share in the company’s growth and success. The corporation issuing the shares makes sure that profits are distributed as dividends to all shareholders.

Types of Shareholding

Preference and equity shares can be broadly divided into two categories.

Preference Shares

A person who has preference shares has the following preferred rights:

  • Get dividends at a certain rate. A dividend is the sum that is delivered to shareholders when a company records profits and extends the same. This is often determined from net profits after necessary expenses have been subtracted.
  • Get the funds back in the event that the business fails. It is possible to dissolve a business by winding it up. When a business closes, it ceases operations and liquidates its assets to settle its debts with creditors, business partners, and shareholders.

Compared to equity shareholders, preference shareholders have less voting rights and may only vote on issues that directly affect their rights.

Equity Shares

Equity shares, often called ordinary shares, include all shares that are not preferred shares.

You have a claim to any earnings distributed to equity shareholders in the form of dividend payments. It is significant to highlight that a company’s management has the authority to determine whether:

  1. It wants to put the money back into the company for expansion or growth; alternatively
  2. Dividends are payments made to shareholders from a company’s profits.

Some businesses do not release any dividends at all. Additionally, even if a company has declared dividends in the past, there is no guarantee that it will do so in the future.

Benefits of Investing in Equity Shares

Equity share investing has some advantages. They consist of:

Potential to Earn a High Income

When you invest in equity shares, your earning potential is doubled:

1. Capital appreciation due to the increase in stock price. 

A share that you paid less for may become more in demand while the supply is still constrained, giving you the chance to make money.

Since most investors anticipate growth in the pharmaceutical industry, there is a surge in demand for the company’s stock after a year, and the stock price rises to INR 150. This presents you with the chance to gain capital appreciation at a 50% rate within a year.

2. Regular income if the company declares dividends.

Shareholders have the right to receive profits that the firm chooses to distribute as a dividend. Your recurring income may increase if you have investments in companies that pay dividends on a yearly basis.

Protection Against Inflation

A product that cost 50 INR in 2010 will cost substantially more in 2020. Money depreciates over time, increasing the amount needed to purchase the same goods and services. Inflation is the name of this occurrence.

If you store your money in a savings account, you might not always be able to beat inflation rates. To maintain their purchasing power, many investors choose financial products that generate larger returns, such stock shares.

As a result, investing in stocks gives you a chance to beat inflation rates and keep the value of your investments constant.

Diversification Across Assets

Asset classes like equity, bonds, real estate, and commodities, among others, can be used to group the various investment possibilities that are accessible. These asset types are divided based on the possible return, the risk to the capital, and the tax consequences.

The earnings on your investment could, however, decrease if the central bank cuts interest rates. You can experience a decline in returns if all of your funds are in fixed deposits.

It is therefore wise to invest in a variety of asset classes so that poor performance in one does not affect your overall results. Even if fixed deposit interest decreases but the value of the equities you own increases, you can still make a profit.

Risks of Investing in Equity Shares

Even if you don’t lose all you invested, you can still find yourself in a situation where a business’s share never reaches the price you paid for it, whether because of company performance or general market attitude. As an investor, you take on these risks in the pursuit of increased profits and wealth accumulation.

The following are the most typical dangers connected with purchasing equity shares:

Capital Loss

Demand and supply for a share affect its market price. Most investors would want to invest in a firm and try to buy its shares if they believe it will perform well in the future.

As a result, there will be more sellers than purchasers in the market for the aforementioned stock, which will cause the supply to outweigh the demand and cause a decline in the company’s market price.

On the other hand, if the announcement of the policy change causes investors to have doubts about the company’s future, demand may decline, which would cause the share price to drop to, say, INR 75. You will experience a loss of INR 2,500 if you sell your shares at that time.

Volatility

The market price of a share may change over a specific time period, which is known as volatility.

Stock prices can quickly become volatile since the market price of a share is based on how investors feel about it generally and is impacted by a variety of outside influences, including social, political, and macroeconomic considerations.

But, if the stock price is extremely volatile, you run the danger of purchasing a stock at a high price, which will raise your profit price. The same holds true for investors selling highly volatile stocks.

They don’t promise you won’t lose money, but they significantly lower the risk compared to investing in one company’s equity share.

The IPO-way

A corporation announces an initial public offering, or IPO, when it issues its first batch of shares. As an investor, you can submit an application for an IPO via your net banking account or submit bids on stock markets for the company’s shares.


What Is the VIX Volatility Index? Why Is It Important?

The Chicago Board of Options Exchange Volatility Index, or VIX, is a gauge for stock market volatility and investor sentiment.

The VIX strives to predict market volatility through the lens of options trades.

What Is the VIX and How Does It Measure Volatility?

The Volatility Index of the Chicago Board of Exchange is referred to in finance as VIX. This index serves as a general benchmark for stock market volatility and gauges S&P 500 index options. The trading environment is more choppy the higher the index level, thus its other moniker, the fear index, is rather appropriate.

Based on a snapshot of trade behaviour over the preceding 30 days, it gauges expected future volatility.

What Do the VIX Numbers Mean?

  • Typically, a VIX reading of 20 or more is regarded as “high.”
  • The VIX is often regarded as “low” below 12.
  • Any age between 12 and 20 is regarded as “normal.”

Put options provide investors the right to sell shares of a stock on a given date at a specific price, therefore investing in a put option is equivalent to betting that the price of a stock will decrease before the put contract expires.

These are investments that can profit from negative feelings like dread; they are bearish. Because it is widely believed that volatility may have peaked or reached a turning point, there is a saying on Wall Street that goes, “When the VIX is high, it’s time to buy.”

In other words, a dropping VIX number means that the stock market’s general mood is more upbeat or positive. The VIX should be thought of as a percentage even though it isn’t expressed that way. At a VIX of 22, the implied volatility for the SPX is 22%.

How Is the VIX Calculated? What Is the VIX Formula?

The VIX is composed of a continually shifting portfolio of SPX options, unlike the S&P 500 index, which is made up of specific equities. It uses both normal weekly SPX options and those with Friday expirations. Further information on the Chicago Board of Options’ process and selection criteria can be found on the website.

How Do I Interpret the VIX?

There are various ways to read the VIX, but it’s crucial to remember that it’s a theoretical index and not a forecasting tool. Fear, the emotion it tracks, is not even something that can be quantified by concrete facts like the most recent Consumer Price Index. Instead, the VIX uses option pricing to predict how the market will behave in the future.

“The VIX does not measure actual volatility, but rather, implied volatility.”

It’s also critical to comprehend how strongly emotions can influence the stock market. For instance, during earnings season, a company may post strong growth but face a sharp decline in its value because it fell short of analyst expectations. Investors trying to preserve their interests by selling their shares, which lowers prices, is an indication of fear.

At its worst, fear-driven selling has the potential to crash the market and trigger feelings of panic that may lead to capitulation.

But, the VIX is not meant to elicit fear.

Can the VIX Go Above 100?

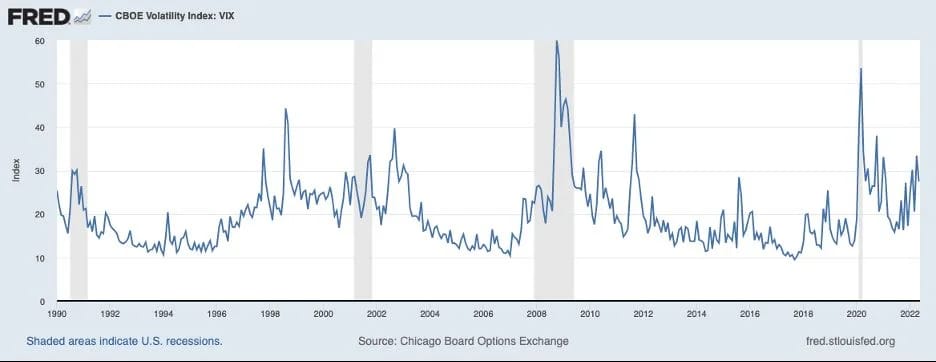
Although it hasn’t done so since data collection started in 1990, theoretically the VIX can rise over 100.

The VIX attained its two highest points at the following times:

  1. The VIX peaked 89.53 on October 24, 2008, at the height of the Financial Crisis, which resulted from the global collapse of mortgage-backed securities.
  2. The VIX peaked at 82.69 on March 16, 2020, at the start of the COVID-19 pandemic.

Experts also contend that the VIX would have reached 100 on Monday, October 19, 1987, during the Black Stock Market Collapse if data collection had started in the 1980s.

The VIX is seen in this chart from the Federal Reserve’s data centre, FRED, from 1990 to 2022. Receding areas are indicated by shading:

How Do I Trade the VIX? Can You Buy Options on the VIX?

Investors can invest in derivatives that track the VIX but cannot directly purchase the VIX itself. Examples of these derivatives include exchange-traded funds (ETFs) based on the VIX, such as ProShares VIX Mid-Term Futures ETF (VIXM), and exchange-traded notes (ETNs), such as the iPath Series B S&P 500 VIX Short-Term Futures ETN (VXX) and the iPath Series B S& (VXZ).

What Is the VIX at Today?

Visit the daily updated website of the Chicago Board of Options Exchange to see the VIX’s current level.

How to Invest in Penny Stocks for Beginners

Penny stocks are frequently the appropriate first stop for novice investors. Penny stocks, as the name suggests, are those businesses that trade with a cheap share price, frequently less than $1. It’s easy to see why novices are drawn in by the idea of investing in a business for a few cents and then profitably selling their shares when the price rises to multiple dollars. Because to the incredibly low prices, an investor can own thousands of shares for a relatively small investment.

But heed this fair warning: Due to their lack of liquidity, wide bid-ask spreads (the amount by which the ask price for an asset exceeds the bid price), small market capitalization, and restricted following and disclosure, such stocks are typically regarded as being highly speculative and high risk.

KEY TAKEAWAYS

  • Companies that frequently trade for less than $1 per share are known as penny stocks.
  • Because the major stock exchanges, such NYSE and Nasdaq, have listing conditions that must be met, including a minimum share price, penny stocks frequently trade off the major market exchanges.
  • Lack of liquidity can be a key problem with penny stocks; it’s not unusual for an investor to become trapped in a position for several days or weeks before there is sufficient supply or demand to enter or leave a position.

Understanding Penny Stocks

A “penny stock” is a securities issued by a small-cap or micro-cap company with a market capitalization of less than $250 million, according to the Securities and Exchange Commission (SEC).
Think of penny stocks as the opposite of blue-chip stocks: they frequently have little or no financial history, or a bad one: The underlying company may be on the verge of bankruptcy. Others define penny stocks as those that trade at less than $5 per share (though some experts choose to adopt a lower cut-off value of $1 per share).

Typically, a penny stock trades off the main stock exchanges. This is due to the large stock exchanges’ listing criteria for the businesses that trade on them, such NYSE and Nasdaq. If a firm fails to maintain a minimum closing bid price of $1 per share after 180 days, Nasdaq will delist its shares.

Narrowing Down Trading Candidates

The next step is to choose which stock to trade once you have a better understanding of where to trade penny stocks. Using stock screening tools, such the one on the OTC Markets website or Finviz, is a common strategy.
The simplest technique to reduce the trading universe is to screen for stocks with a price below $1.

Depending on your approach and level of risk tolerance, you can further narrow the selection down from here.

Your list, based on the filter above, should resemble this once you master using Finviz’s stock screener:

No.TickerCompanySectorPrice ($)
1ASRTAssertio Holdings, Inc.Drug Manufacturers0.99
2CPHIChina Pharma Holdings, Inc.Drug Manufacturers0.67
3NEPTNeptune Wellness Solutions, Inc.Drug Manufacturers0.66
4RMTIRockwell Medical, Inc.Drug Manufacturers0.65
5SNDLSundial Growers, Inc.Drug Manufacturers0.72
6TLGTTeligent, Inc.Drug Manufacturers0.45
7TXMDTherapeuticsMD, Inc.Drug Manufacturers0.77
8ZOMZomedica Corp.Drug Manufacturers0.60

Opening an Account

When opening a trading account, there are numerous things to take into account, including costs, customer service, and how simple it is to move money. Choose a broker that will fulfil your needs by taking your time to compare their specialisations. The fee structure is one element that penny stock investors should pay close attention to. Some brokers charge commissions based on the number of shares.

A per-share structure might be more appropriate for buyers of a small number of shares, but it might not be the ideal option for penny stock traders.

Understanding the Risks

It’s crucial to comprehend the dangers associated with trading penny stocks. These securities typically don’t have a following in the financial community because the majority of institutional investors, such as mutual funds, index funds, and money managers, are prohibited by charter from trading penny stocks.

Since retail investors frequently become caught in a position for days or weeks before there is enough supply or demand to enter or exit, suffering significant price changes along the way, liquidity is a key concern.

What Is the Ideal Number of Stocks to Have in a Portfolio?

What Is the Ideal Number of Stocks to Have in a Portfolio?

There is no one proper answer to this topic, despite the appearance that many sources have an opinion on the “appropriate” quantity of companies to purchase in a portfolio.

The ideal amount of stocks to own in your portfolio relies on a variety of variables, including your nation of residence and investment, your time horizon for investing, the state of the market, and how frequently you read the news about the market and your holdings.

KEY TAKEAWAYS

  • There isn’t really a single proper response to this topic, despite the fact that many sites have an opinion on the “appropriate” quantity of stocks to purchase.
  • The ideal quantity of stocks to own may vary depending on your investment time horizon, the state of the market, and how frequently you will review your holdings.
  • Diversification is unquestionably essential to long-term returns, despite the fact that there is no universally accepted answer to this question.
  • A well-diversified portfolio lessens exposure to unsystematic risk, or the risk connected to a certain business or sector.
  • But take into account the costs associated with owning more and more stocks. In general, it is best to keep the fewest possible stocks in order to effectively reduce one’s exposure to unsystematic risk.

Understanding the Ideal Number of Stocks to Have in a Portfolio

Investors diversify their resources among a variety of investment vehicles primarily to reduce risk exposure.
Particularly, diversity enables investors to lessen their exposure to unsystematic risk, which is defined as the risk connected to a specific business or industry.

A well-diversified equity portfolio can effectively reduce unsystematic risk to nearly zero levels while maintaining the same expected return level as a portfolio with excess risk, according to academic research in the field of modern portfolio theory. Investors are unable to diversify away systematic risk, such as the risk that an economic recession will bring down the entire stock market.

To put it another way, investors typically do not benefit from improved return potential for assuming unsystematic risk, even when they must take greater systematic risk for potentially higher profits (a situation known as the risk-return tradeoff).

The more stocks you have in your portfolio, the less exposed you are to unsystematic risk. A portfolio with 10 or more stocks—especially one with stocks from different sectors or industries—is substantially less risky than one with just two stocks.

Consider Transaction Fees

It is often best to hold the bare minimum of stocks required to completely eliminate their exposure to unsystematic risk because the transaction costs associated with holding more equities can certainly pile up. How much is this number? There is a reasonable range, but there is no agreed-upon answer.

Recent studies indicate that holding as many stocks as an investor desires can help them maximise their portfolios by taking advantage of the reduced transaction costs provided by online brokers. There is a time-cost fallacy, too, and most investors discover that by selecting index-based assets instead, their portfolios can perform at least as well. Exchange-traded funds are these (ETFs).

You might want to think about using index funds or ETFs to provide quick and easy diversification across different sectors and market cap groups if the thought of having to research, choose, and keep up-to-date awareness of numerous different individual stocks intimidates you. These investment vehicles effectively let you buy a basket of stocks with a single transaction.

How Many Stocks Should You Own for a Diversified Portfolio?

Although there isn’t a magic number, it is generally accepted that investors should diversify their portfolio across the industries they want exposure to while maintaining a healthy allocation in fixed-income securities to protect themselves against downturns in specific companies or industries. This typically equates to a minimum of 10 stocks.

How Many Stocks and Bonds Should Be in a Portfolio?

The solution is based on the strategy you use for asset allocation. You could devote 100% of your portfolio to stocks if you adopt an extremely aggressive strategy. being a little bit pushy. shift 20% of your assets to cash and bonds and 80% of it to stocks.

Keep 60% of your portfolio in stocks and 40% in cash and bonds if you want moderate development. Finally, take a conservative strategy and invest no more than 50% of your money in stocks if you want to safeguard your capital rather than obtain higher returns.

How Many Stocks Should I Own With $10,000?

ETFs are the method of choice for investors who want to spread their holdings. This enables them to acquire a much wider range of businesses than they could if they bought individual shares of each one. A $10,000 investment into several ETFs could give the investor exposure to thousands of assets.

List of Stocks Registered in NSE: What You Must Know About Them

The National Stock Exchange (NSE), the Bombay Stock Exchange (BSE), or both may list a private firm when it makes an initial public offering (IPO). After a company is listed on a stock exchange, investors can purchase and sell its shares. The public, including institutional investors, investors from other countries, and retail investors, are other sources of funding for the business. In India, the two most well-known and important stock exchanges are NSE and BSE.

In the NSE, more over 1600 companies are listed. On the NSE, only 1328 businesses are now actively traded. On the NSE India website, you can view a list of the companies that are NSE registered. Equity, equity derivatives, currency derivatives, commodities derivatives, and debt are the allowed market categories on the NSE. In this post, we’ll learn about the NSE, how to access a list of all the companies that are listed there, the top NSE-registered businesses, and more.

What is NSE?

The National Stock Exchange, or NSE, was established in 1992 and commenced operations in 1994. It is India’s most well-known and important stock market. Located in Mumbai, Maharashtra, it was the first exchange to launch electronic or screen-based trading. Leading banks, insurers, financial institutions, and other financial intermediaries created it. Ashishkumar Chauhan serves as the managing director and chief executive officer of NSE.

A stock exchange is a marketplace where investors can purchase and sell shares. In other words, it serves as a venue for the exchange of shares between buyers and sellers. The stock exchange’s primary responsibility is to match buy and sell orders. As an illustration, trader “A” has ordered to purchase 10 shares at Rs. 100, and trader “B” has ordered to sell 10 shares at Rs. 100. The stock exchange will in this instance match these orders based on price-time priority. A clearing company is used to settle the transaction.

The fundamental goals of the NSE were to create trading platforms for diverse securities kinds, guarantee equal opportunity for all investors, and create a transparent securities market through an electronic trading system. Additionally, it has introduced a number of new products, including corporate bonds, interest rate futures, currency derivatives, and government securities (G-Secs) (IRFs).

The major broad market indices of NSE are Nifty 50, Nifty Next 50, Nifty 100, Nifty 200, Nifty 500, Nifty Midcap 50, Nifty Smallcap 100, etc. the major sectoral indices of NSE are Nifty Bank, Nifty Auto, Nifty FMCG, Nifty IT, Nifty Pharma, Nifty PSU bank, etc. 

Growth of the number of companies listed in NSE from 2011 to 2020 :

YearNo of the listed companies in NSE
FY 20201,959
FY 20191,955
FY 20181,923
FY 20171,817
FY 20161,808
FY 20151,736
FY 20141,688
FY 20131,666
FY 20121,646
FY 20111,574

How to find the list of all companies in the NSE? 

The NSE’s official website has a list of the companies that are registered with it. Simply conduct a google search for NSE.

  1. Visit the NSE website: https://www.NSEindia.com
  2. From the top menu bar, select market data. 
  3. under the trade information section, you will find securities available for trading. These are actively traded securities in the stock market. 
  4. Select securities available for trading. 
  5. Next, you will find securities available for the equity segment. Click on this to download the total listed companies in NSE.
  6. You can find all listed companies in India from stock screener websites like screener. In and money control. 
Company’s nameLast traded price (Rs.)52 week high52 week lowMarket cap (Rs. Cr. )
Reliance Industries2.617.602,856.152,810.001,770,984.97
TCS3,389.654,043.002,926.101,240,290.35
HDFC Bank1,617.651,722.101,271.609,017,74.79
Infosys1,635.651,953.901,355.006,882,94.74
ICICI Bank930.30943.25642.156,488,07.45
HUL2,537.452,734.001,901.555,961,97.03
SBI607.40622.70425.005,420,80.92
HDFC2,681.352,933.802,026.004,885,05.73
Bharti Airtel846.85860.55628.754,794,27.49
Adani Enterprises3,901.104,096.001,528.804,447,25.84
ITC340.30361.45207.004,223,23.20
Bajaj Finance6,747.508,045.005,220.004,085,13.37
Adani Total Gas3,664.753,912.401,510.304,030,52.90
LIC India627.75949.00588.003,970,51.73
Kotak Mahindra1,928.402,048.001,631.003,829,43.95
Adani Green Energy2,023.953,050.001,235.003,206,00.25
HCL Technology1,128.201,359.40877.353,061,55.70
Adani Transmission2,739.604,236.751,650.253,056,00.38
Asian Paints3,108.153,590.002,560.002,981,33.06
Larsen and Toubro2,062.752,095.801,456.352,898,91.49

About the Top NSE Registered Companies

Reliance Industries: Dhirubhai Ambani founded Reliance Industries Ltd., which is listed among the Fortune 500 companies. Textiles, energy, retail, entertainment, materials, and digital services are among the industries it operates in. When it comes to the company’s fundamental measures, the ROCE is 9.42%, ROE is 8.16%, and Stock P/E is 27.6. Compound annual growth rates (CAGRs) for stock prices and profits over the past five years are 23% and 14%, respectively.

HDFC Bank: The first bank to receive RBI approval to open a bank in the private sector was HDFC Bank, which was founded in 1994. Many banking and financial services are offered by it. Dividend yield is 0.96%, ROCE is 5.83%, ROE is 16.6%, and the stock P/E is 21.6. For the past five years, the company has experienced solid profit growth of 20.0% CAGR.

Infosys: The business offers consulting, digital, outsourcing, and technology services. The ROCE is 37.1%, the ROE is 29.0%, the dividend yield is 1.90%, and the stock’s P/E is 30.1. For the past three years, the company’s ROE has been 27.2%, while its dividend payout has been 54.3%.

ICICI Bank: To corporate clients, retail clients, and SMEs, the ICICI bank provides a range of financial products and services. The company’s ROCE is 5.59%, its ROE is 14.8%, its dividend yield is 0.54%, and its stock price to earnings ratio is 21.9. Compound annual revenue growth (CAGR) for profits over the previous five years was 20%, while CAGR for stock prices was 24%.

Infosys: The business offers consulting, digital, outsourcing, and technology services. The ROCE is 37.1%, the ROE is 29.0%, the dividend yield is 1.90%, and the stock’s P/E is 30.1. For the past three years, the company’s ROE has been 27.2%, while its dividend payout has been 54.3%.

In conclusion, you can now make a more informed decision about your investments now that you are aware of how many companies are listed on the NSE and the top list of all listed companies in India. The NSE offers updates on the top gainers and losers stocks every trading day, a list of the most active stocks based on trading volume, the top NSE firms by market size, the top NSE indices, and more in addition to allowing traders to trade in a variety of securities. High risks are connected to the stock market. So, it is crucial to educate yourself on the stock market’s numerous facets.

This is not financial advice. Only informational purposes are served by the blog. Securities market investments are exposed to market risks; before making an investment, thoroughly read all pertinent documentation. Future returns cannot be predicted by past performance. Before selecting a fund or creating a portfolio that meets your needs, please take into account your unique investing needs, risk tolerance, goal, time frame, risk and reward balance, and the cost associated with the investment. Each investment portfolio’s performance and returns are neither predicable nor guaranteed.