
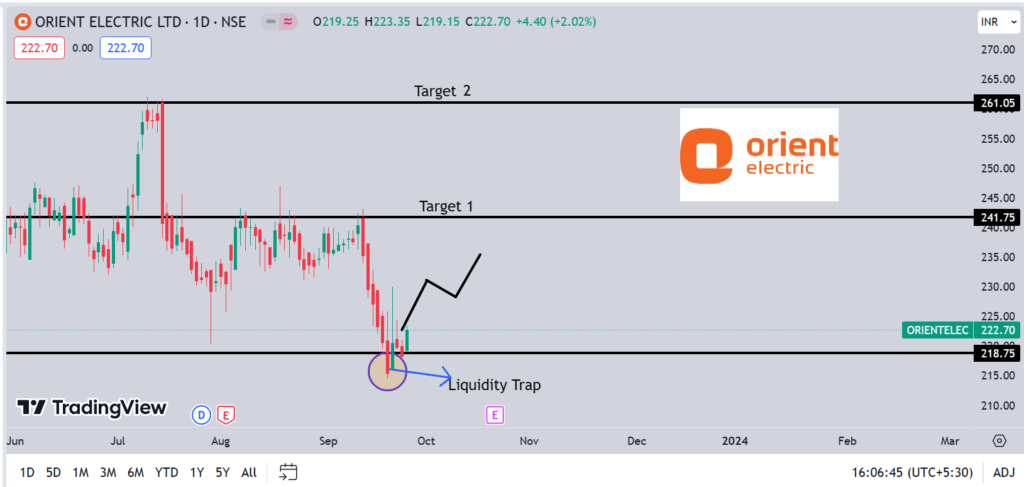
An Indian company called Orient Electric Limited provides electrical solutions for everyday life. The company’s main business activities include the production, acquisition, and marketing of switchgear, lighting, and other electrical consumer durables. The company has production facilities in Kolkata, Noida, and Faridabad. Lighting and Switchgear and Electrical Consumer Durables make up the company’s two business segments. Our experts advice that one can buy orient electric shares at Rs220 with a target of 240 and 260.
Technical Analysis
Let us look at the Fundamentals
Profit & Loss
Figures in Rs. CroresPRODUCT SEGMENTS
| Mar 2017 | Mar 2018 | Mar 2019 | Mar 2020 | Mar 2021 | Mar 2022 | Mar 2023 | TTM | |
|---|---|---|---|---|---|---|---|---|
| Sales + | 212 | 1,600 | 1,864 | 2,062 | 2,033 | 2,448 | 2,529 | 2,613 |
| Expenses + | 188 | 1,461 | 1,721 | 1,885 | 1,813 | 2,217 | 2,378 | 2,456 |
| Operating Profit | 24 | 139 | 143 | 177 | 220 | 231 | 151 | 157 |
| OPM % | 11% | 9% | 8% | 9% | 11% | 9% | 6% | 6% |
| Other Income + | 1 | 3 | 8 | 4 | 6 | 6 | 27 | 24 |
| Interest | 3 | 24 | 23 | 26 | 21 | 20 | 22 | 23 |
| Depreciation | 2 | 20 | 23 | 40 | 43 | 47 | 54 | 55 |
| Profit before tax | 20 | 98 | 105 | 114 | 162 | 170 | 102 | 103 |
| Tax % | 41% | 35% | 34% | 31% | 26% | 25% | 26% | |
| Net Profit + | 12 | 64 | 69 | 79 | 120 | 127 | 76 | 77 |
| EPS in Rs | 3.02 | 3.27 | 3.71 | 5.64 | 5.97 | 3.56 | 3.60 | |
| Dividend Payout % | 0% | 33% | 31% | 31% | 35% | 34% | 42% |
| Compounded Sales Growth | |
|---|---|
| 10 Years: | % |
| 5 Years: | 10% |
| 3 Years: | 7% |
| TTM: | -1% |
| Compounded Profit Growth | |
|---|---|
| 10 Years: | % |
| 5 Years: | 3% |
| 3 Years: | -1% |
| TTM: | -46% |
| Stock Price CAGR | |
|---|---|
| 10 Years: | % |
| 5 Years: | 10% |
| 3 Years: | 7% |
| 1 Year: | -19% |
| Return on Equity | |
|---|---|
| 10 Years: | % |
| 5 Years: | 23% |
| 3 Years: | 22% |
| Last Year: | 13% |
Balance Sheet
Figures in Rs. CroresCORPORATE ACTIONS
| Mar 2017 | Mar 2018 | Mar 2019 | Mar 2020 | Mar 2021 | Mar 2022 | Mar 2023 | |
|---|---|---|---|---|---|---|---|
| Share Capital + | 21 | 21 | 21 | 21 | 21 | 21 | 21 |
| Reserves | 192 | 242 | 285 | 338 | 434 | 520 | 563 |
| Borrowings + | 211 | 186 | 135 | 155 | 61 | 68 | 97 |
| Other Liabilities + | 338 | 359 | 447 | 446 | 645 | 579 | 583 |
| Total Liabilities | 740 | 808 | 889 | 960 | 1,162 | 1,187 | 1,265 |
| Fixed Assets + | 109 | 106 | 117 | 190 | 186 | 212 | 226 |
| CWIP | 0 | 5 | 4 | 10 | 11 | 3 | 86 |
| Investments | 0 | 0 | 0 | 0 | 0 | 0 | 0 |
| Other Assets + | 630 | 698 | 768 | 760 | 965 | 972 | 953 |
| Total Assets | 740 | 808 | 889 | 960 | 1,162 | 1,187 | 1,265 |