Dwarikesh Sugar shares are one of the multibagger stocks in Indian stock market that has delivered strong returns in post-Covid rally. If an investor had invested ₹1 lakh in this sugar stock five years ago, its ₹1 lakh would have turned to ₹4 lakh today.
Multibagger Stock
When explaining how to become wealthy through stock market investments, seasoned investors have frequently advised trying to hold onto a stock for as long as possible. They encourage a positional investor who wants to profit from stocks to use the “buy, sell, and forget” technique.
We must examine Dwarikesh Sugar shares in order to comprehend how a long-term investor might profit from their investments. One of the multibagger stocks on the Indian stock market, it increased the value of its stockholders from 1 lakh to 54 lakh during the past ten years.
Despite being under stress for the previous year, the multibagger sugar stock has increased.
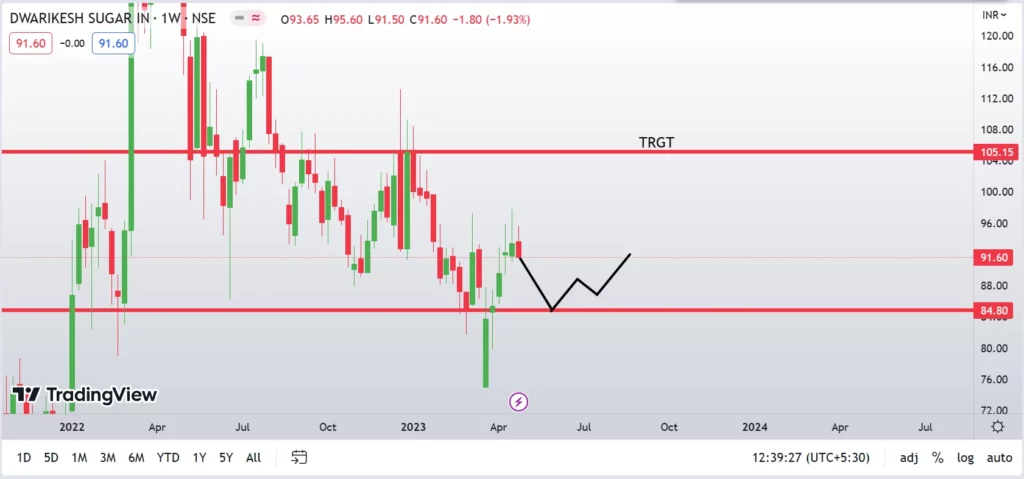
Dwarikesh Sugar Industries’ stock has been in base-building mode for the past year, but it was one of the stocks that experienced a notable resurgence during the post-Covid stock market recovery.
Dwarikesh Sugar Share is one of the multibagger stocks that the Indian stock market has generated in recent years, and it has a history of providing exceptional returns to its shareholders. This multibagger sugar stock has increased from about $1.70 to $92 per share over the past ten years, giving its stockholders a return of more than 5,300%.
Let us look at the Fundamentals
Profit & Loss
Standalone Figures in Rs. Crores / View ConsolidatedPRODUCT SEGMENTS
| Sep 2011 | Sep 2012 | Sep 2013 | Mar 2015 | Mar 2016 | Mar 2017 | Mar 2018 | Mar 2019 | Mar 2020 | Mar 2021 | Mar 2022 | Mar 2023 | |
|---|---|---|---|---|---|---|---|---|---|---|---|---|
| Sales + | 593 | 699 | 928 | 1,128 | 794 | 1,190 | 1,430 | 1,084 | 1,336 | 1,839 | 1,974 | 2,103 |
| Expenses + | 519 | 605 | 869 | 1,043 | 686 | 917 | 1,287 | 955 | 1,200 | 1,638 | 1,683 | 1,888 |
| Operating Profit | 75 | 94 | 59 | 86 | 108 | 273 | 142 | 129 | 136 | 201 | 291 | 215 |
| OPM % | 13% | 13% | 6% | 8% | 14% | 23% | 10% | 12% | 10% | 11% | 15% | 10% |
| Other Income + | 0 | 2 | 13 | 10 | 13 | 18 | 17 | 36 | 5 | 7 | 3 | 14 |
| Interest | 60 | 79 | 71 | 75 | 52 | 52 | 25 | 21 | 33 | 48 | 32 | 26 |
| Depreciation | 33 | 33 | 33 | 47 | 31 | 30 | 32 | 33 | 37 | 41 | 44 | 50 |
| Profit before tax | -18 | -16 | -32 | -27 | 39 | 209 | 102 | 111 | 72 | 120 | 219 | 152 |
| Tax % | 26% | 28% | 39% | 37% | 1% | 25% | 1% | 14% | -3% | 24% | 29% | 31% |
| Net Profit | -13 | -11 | -19 | -17 | 39 | 156 | 101 | 95 | 73 | 92 | 155 | 105 |
| EPS in Rs | -0.81 | -0.69 | -1.19 | -1.03 | 2.39 | 8.29 | 5.39 | 5.05 | 3.90 | 4.86 | 8.24 | 5.57 |
| Dividend Payout % | 0% | 0% | 0% | 0% | 0% | 12% | 0% | 20% | 26% | 26% | 24% | 36% |
| Compounded Sales Growth | |
|---|---|
| 10 Years: | 12% |
| 5 Years: | 8% |
| 3 Years: | 16% |
| TTM: | 7% |
| Compounded Profit Growth | |
|---|---|
| 10 Years: | 27% |
| 5 Years: | 1% |
| 3 Years: | 13% |
| TTM: | -32% |
| Stock Price CAGR | |
|---|---|
| 10 Years: | 41% |
| 5 Years: | 29% |
| 3 Years: | 71% |
| 1 Year: | -28% |
| Return on Equity | |
|---|---|
| 10 Years: | 21% |
| 5 Years: | 19% |
| 3 Years: | 19% |
| Last Year: | 15% |
Balance Sheet
Standalone Figures in Rs. Crores / View ConsolidatedCORPORATE ACTIONS
| Sep 2011 | Sep 2012 | Sep 2013 | Mar 2015 | Mar 2016 | Mar 2017 | Mar 2018 | Mar 2019 | Mar 2020 | Mar 2021 | Mar 2022 | Mar 2023 | |
|---|---|---|---|---|---|---|---|---|---|---|---|---|
| Share Capital + | 32 | 32 | 47 | 47 | 47 | 19 | 19 | 19 | 19 | 19 | 19 | 19 |
| Reserves | 104 | 103 | 73 | 56 | 70 | 267 | 347 | 445 | 465 | 560 | 654 | 721 |
| Borrowings + | 467 | 525 | 392 | 624 | 656 | 533 | 342 | 656 | 846 | 609 | 524 | 375 |
| Other Liabilities + | 66 | 108 | 179 | 302 | 260 | 200 | 276 | 246 | 279 | 257 | 222 | 166 |
| Total Liabilities | 653 | 752 | 660 | 999 | 1,001 | 1,019 | 984 | 1,365 | 1,609 | 1,445 | 1,420 | 1,280 |
| Fixed Assets + | 496 | 470 | 440 | 399 | 356 | 331 | 341 | 319 | 430 | 410 | 388 | 582 |
| CWIP | 5 | 0 | 0 | 0 | 0 | 1 | 0 | 16 | 2 | 1 | 142 | 0 |
| Investments | 0 | 0 | 0 | 0 | 0 | 0 | 0 | 0 | 0 | 0 | 0 | 0 |
| Other Assets + | 153 | 282 | 220 | 600 | 644 | 687 | 642 | 1,029 | 1,177 | 1,035 | 889 | 697 |
| Total Assets | 653 | 752 | 660 | 999 | 1,001 | 1,019 | 984 | 1,365 | 1,609 | 1,445 | 1,420 | 1,280 |
Disclaimer : The information mentioned above is merely an opinion and should only be treated for educational purposes. If you have any questions or feedback about this article, you can write us back. To reach out, you can use our contact us page.