
What are Candle Patterns
A technical technique known as a candlestick chart condenses data from many time frames into a single price bar. They are therefore more beneficial than conventional open, high, low, close (OHLC) bars or straightforward lines that connect closing price dots. Candlesticks create patterns that, when finished, may be used to forecast price movement.
The Morning Star
After a slump, the Morning Star multiple candlestick chart pattern forms, signaling a bullish reversal.
It consists of three candlesticks: a bearish candle in the first, a Doji in the second, and a bullish candle in the third.
The first candle indicates that the downward trend is still in effect. A Doji on the second candle suggests market uncertainty. The market’s bulls are back, and a reversal will occur, according to the third bullish candle.
The true bodies of the first and third candles should be entirely clear of the second candle.
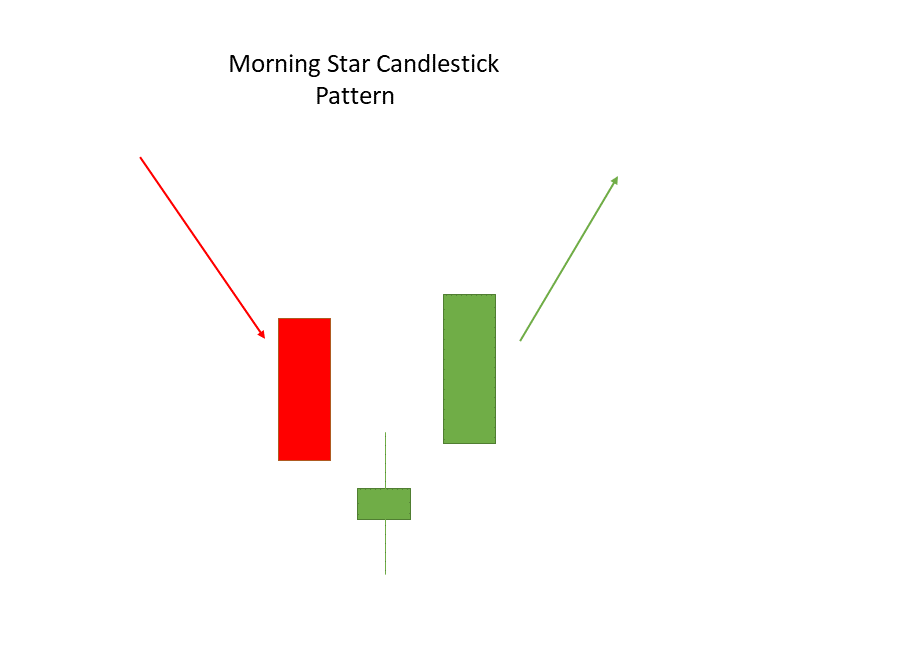
Example:

The Evening Star
The numerous candlestick pattern known as the Evening Star is formed after an uptrend and indicates a negative reversal.
It consists of three candlesticks: a bullish candle, a doji candle, and a bearish candle.
The first candle represents the uptrend continuing, the second candle is a Doji and represents market uncertainty, and the third bearish candle represents the return of the bears and the impending reversal.
The true bodies of the first and third candles should be entirely clear of the second candle.
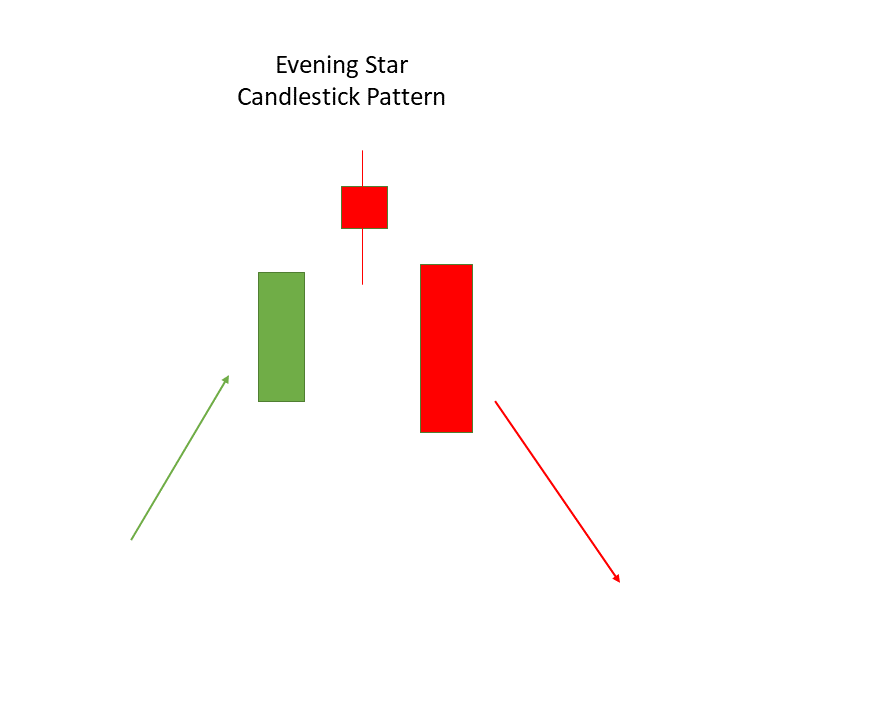
Example:
Disclaimer : The information mentioned above is merely an opinion and should only be treated for educational purposes. If you have any questions or feedback about this article, you can write us back. To reach out, you can use our contact us page.Support@learningsharks.in