
What are Chart Patterns?
Stock chart patterns often signal transitions between rising and falling trends. A price pattern is a recognizable configuration of price movement identified using a series of trendlines and/or curves.
When a price pattern signals a change in trend direction, it is known as a reversal pattern; a continuation pattern occurs when the trend continues in its existing direction following a brief pause. There are many patterns used by traders.
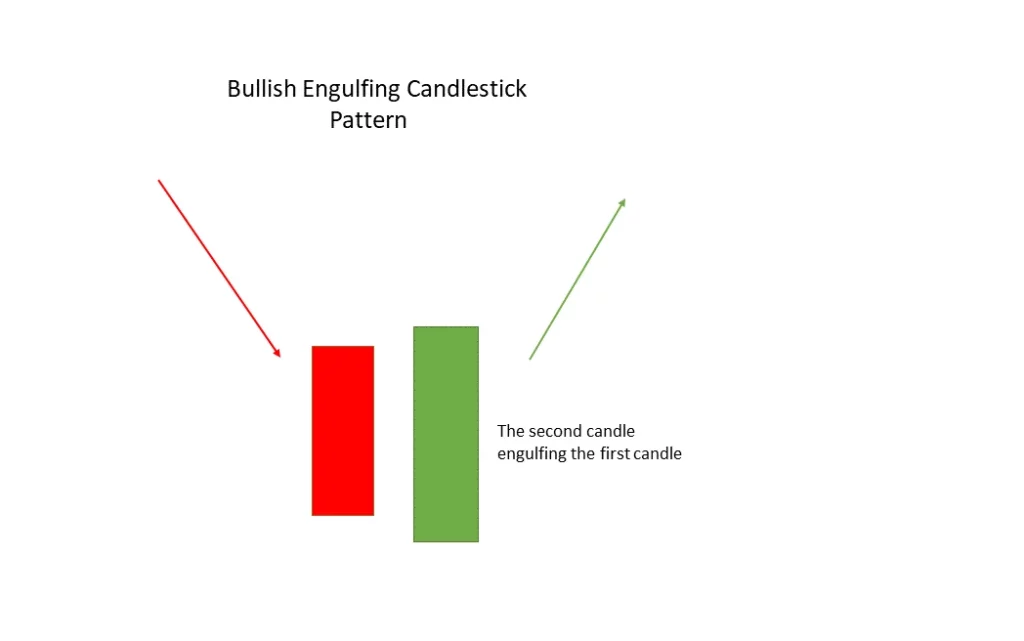
Bullish Engulfing
After a decline, the multiple candlestick chart pattern known as “Bullish Engulfing” forms, signaling a bullish turnaround.
Two candlesticks are used to make it, with the second candlestick enveloping the first. The decline is expected to continue as the first candle is negative.
The first candle is entirely engulfed by the second candlestick, which indicates that the bulls have returned to the market.
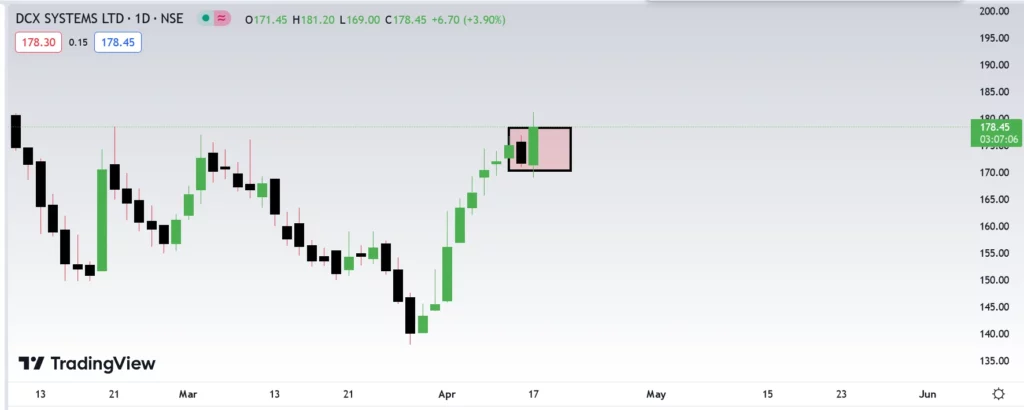
Example:
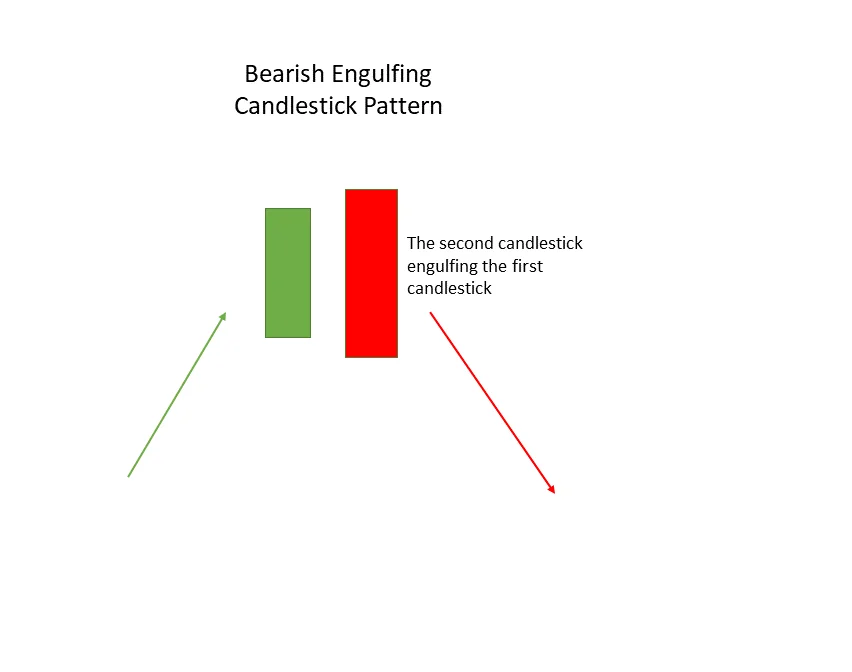
Bearish Engulfing
A numerous candlestick pattern called a “bearish engulfing” forms after an uptrend and denotes a bearish reversal.
Two candlesticks are used to make it, with the second candlestick enveloping the first. The fact that the first candle is bullish suggests that the uptrend will continue.
The lengthy bearish candle on the second candlestick chart totally engulfs the first candle, signaling the return of the bears to the market.
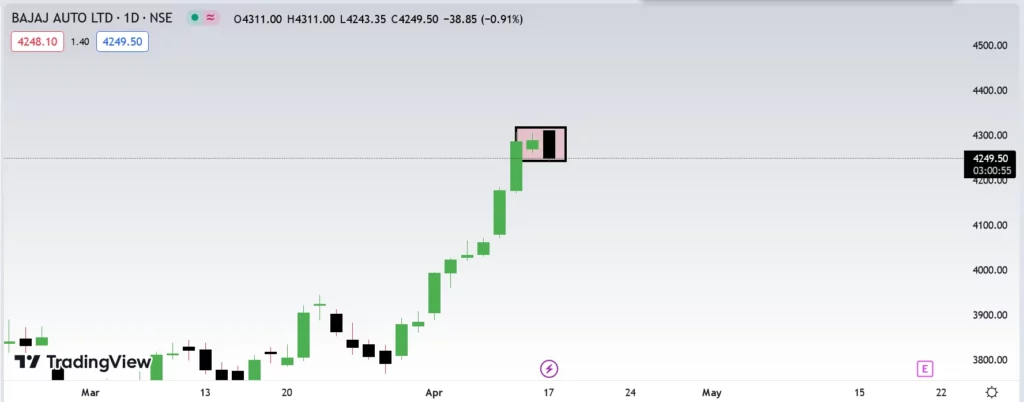
Example:
Disclaimer : The information mentioned above is merely an opinion and should only be treated for educational purposes. If you have any questions or feedback about this article, you can write us back. To reach out, you can use our contact us page Support@learningsharks.in