What is Trading?
Compared to investing, which uses a buy-and-hold approach, trading involves active engagement in the financial markets. The ability of a trader to be profitable over the long term is a prerequisite for trading success.
Anyone who participates in the buying and selling of financial assets on any financial market is a trader. He or she has the option to buy or sell on their own behalf or on behalf of another person or organization. The length of time that an investor or trader hangs onto an asset is the main distinction between them. The costs of paying brokers in the form of various commission rates and capital gains taxes, which are applicable to trades, are two drawbacks of trading.
What are Candle Patterns
A technical technique known as a candlestick chart condenses data from many time frames into a single price bar. They are therefore more beneficial than conventional open, high, low, close (OHLC) bars or straightforward lines that connect closing price dots. Candlesticks create patterns that, when finished, may be used to forecast price movement. This vibrant technical instrument, which was first used by Japanese rice traders in the 18th century, gains depth with proper color coding.
Candlesticks are typically employed daily with the theory that each candle represents a complete day’s worth of news, data, and price movement. This implies that swing or longer-term traders might benefit more from candles.
Most importantly, every candle has a tale to tell. The best way to look at a candle is as a competition between buyers and sellers. A light candle (green or white are usual default displays) indicates that the day belonged to the purchasers, whilst a dark candle (red or black) indicates that the day belonged to the sellers. But what makes candlesticks so appealing as a charting tool is what transpires between the open and the close, as well as the struggle between buyers and sellers.
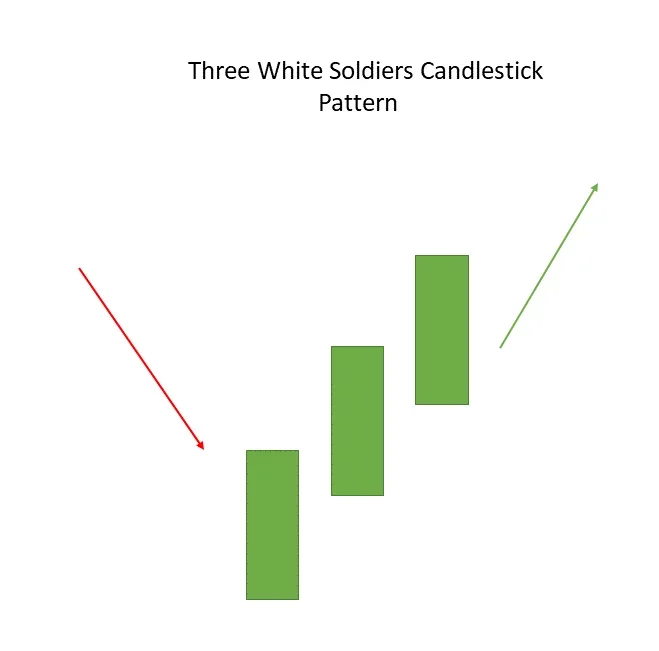
Three White Soldiers
A decline is followed by the formation of the Three White Soldiers, a multiple candlestick pattern that denotes a bullish reversal.
These candlestick charts are formed of three long bullish bodies that are open within the previous candle’s true body and do not have extended shadows.
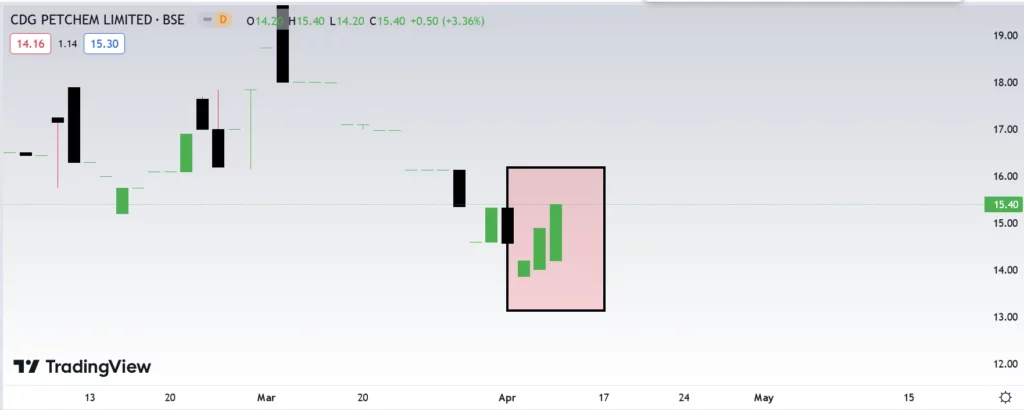
Example:
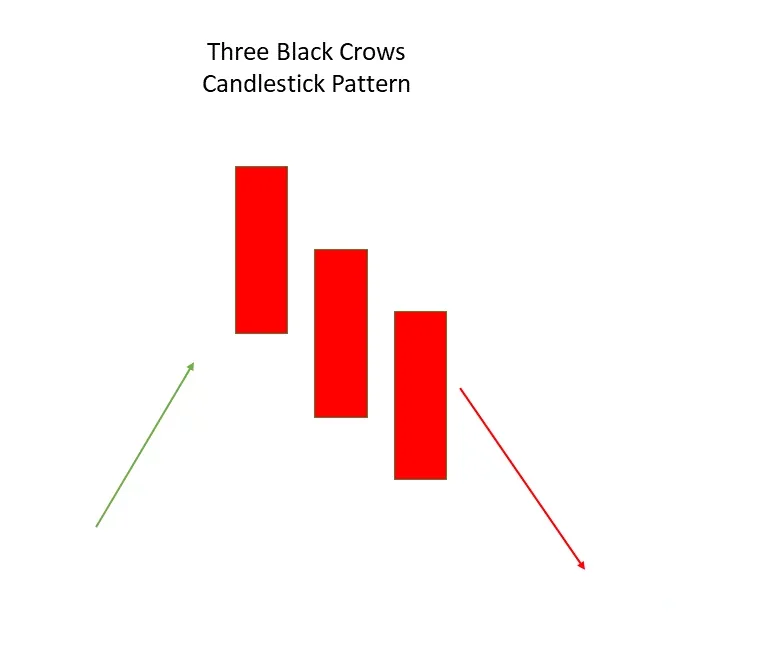
Three Black Crows
After an ascent, a multiple candlestick pattern called The Three Black Crows is produced, signaling a bearish reversal.
These candlesticks are composed of three long bearish bodies that open inside the true body of the preceding candle in the pattern and do not have extended shadows.
Example:
Disclaimer : The information mentioned above is merely an opinion and should only be treated for educational purposes. If you have any questions or feedback about this article, you can write us back. To reach out, you can use our contact us pageSupport@learningsharks.in