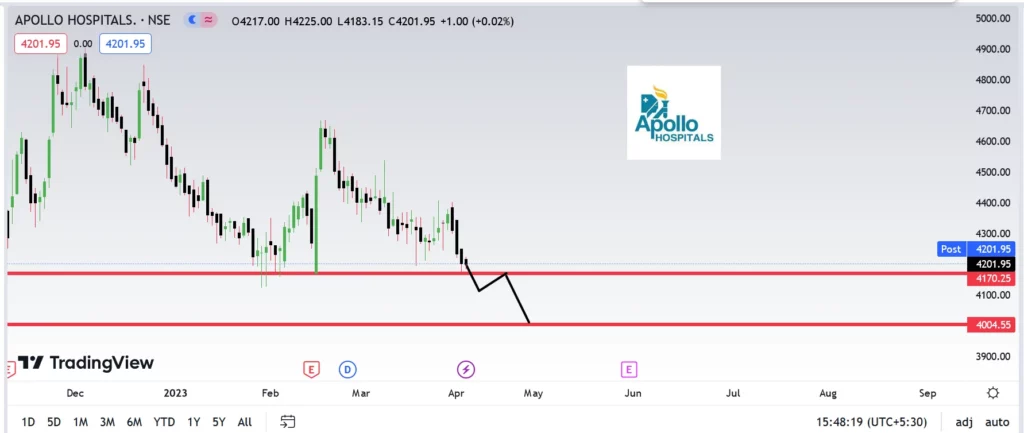
In trading on Thursday, shares of Apollo Hospitals Enterprise Ltd. increased 0.2% to Rs 4210. During the session, it reached a high of Rs 4224 and a low of Rs 4183.05.
The stock’s 200-DMA was at Rs. 4340.61 on the technical indicators, and its 50-DMA was at Rs. 4352.98. A stock is typically in an upward pattern if it trades above both its 50-DMA and 200-DMA. On the other hand, a company is said to be in a bearish trend if it trades between its 50-DMA and 200-DMA, and vice versa.The moving average convergence divergence, or MACD, momentum indicator’s signal line was broken by the company, indicating a bearish bias for the stock. When it comes to traded securities or indices, the MACD is renowned for predicting pattern reversals. The disparity between the 12-day and 26-day exponential moving averages is what determines price. The signal line, a nine-day exponential moving average, is drawn over the MACD to represent “buy” or “sell” chances.
Let us look at the Fundamentals
Profit & Loss
Consolidated Figures in Rs. Crores / View StandalonePRODUCT SEGMENTS
Mar 2011
Mar 2012
Mar 2013
Mar 2014
Mar 2015
Mar 2016
Mar 2017
Mar 2018
Mar 2019
Mar 2020
Mar 2021
Mar 2022
TTM
Sales +
2,605
3,148
3,769
4,357
5,129
6,150
7,256
8,243
9,617
11,247
10,560
14,663
15,857
Expenses +
2,183
2,631
3,157
3,681
4,392
5,465
6,522
7,442
8,548
9,656
9,420
12,474
13,879
Operating Profit
422
517
612
676
737
684
734
801
1,070
1,591
1,140
2,189
1,978
OPM %
16%
16%
16%
16%
14%
11%
10%
10%
11%
14%
11%
15%
12%
Other Income +
12
22
33
18
47
92
60
24
26
222
103
368
108
Interest
78
89
103
119
118
180
257
295
327
533
449
379
380
Depreciation
95
124
142
168
212
264
314
359
396
620
573
601
623
Profit before tax
261
326
399
407
455
332
222
171
373
660
221
1,578
1,083
Tax %
33%
35%
26%
25%
29%
29%
41%
65%
47%
34%
38%
30%
Net Profit
182
218
303
315
335
235
131
60
200
432
137
1,108
796
EPS in Rs
14.75
16.31
21.88
22.77
24.43
16.99
15.88
8.44
16.96
32.70
10.46
73.42
53.18
Dividend Payout %
25%
25%
25%
25%
24%
35%
38%
59%
35%
18%
29%
16%
Compounded Sales Growth
10 Years:
17%
5 Years:
15%
3 Years:
15%
TTM:
13%
Compounded Profit Growth
10 Years:
14%
5 Years:
45%
3 Years:
62%
TTM:
-13%
Stock Price CAGR
10 Years:
18%
5 Years:
31%
3 Years:
52%
1 Year:
-7%
Return on Equity
10 Years:
8%
5 Years:
8%
3 Years:
10%
Last Year:
17%
Balance Sheet
Consolidated Figures in Rs. Crores / View StandaloneCORPORATE ACTIONS