Brokerage firms Antique started a buy on Arvind Smartspace, JPMorgan kept an overweight rating on Bajaj Auto, and IDBI Capital also started covering on Coforge with a buy rating.
From ETNow and other sources, we have compiled a list of the best brokerage firms’ recommendations:
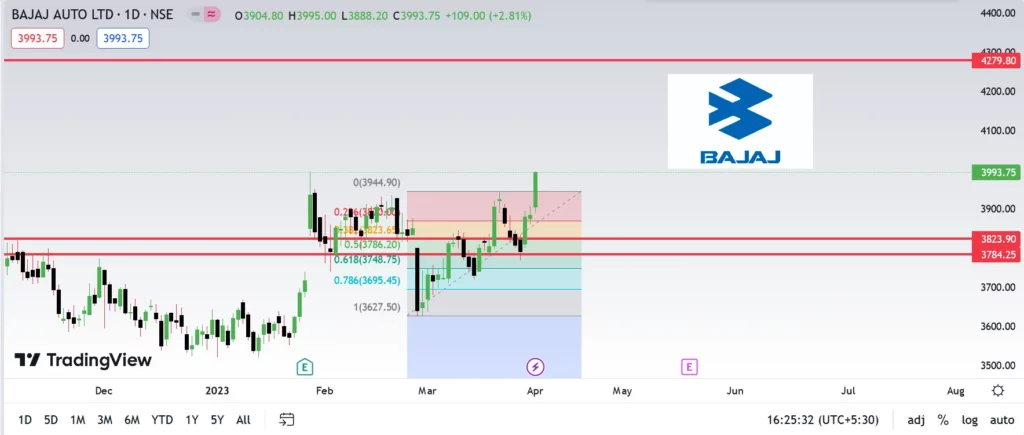
On Bajaj Auto, JPMorgan says: Overweight | Target: Rs. 4400 | Upside 16%
Let us Look at the Fundamentals Profit & Loss
Consolidated Figures in Rs. Crores / View Standalone PRODUCT SEGMENTS
Mar 2011 Mar 2012 Mar 2013 Mar 2014 Mar 2015 Mar 2016 Mar 2017 Mar 2018 Mar 2019 Mar 2020 Mar 2021 Mar 2022 TTM Sales + 16,408 19,582 20,025 20,137 21,595 22,574 21,755 25,210 30,358 29,919 27,741 33,145 35,501 Expenses + 13,229 15,901 16,370 15,974 17,467 17,781 17,326 20,364 25,160 24,809 22,803 27,886 29,347 Operating Profit 3,179 3,681 3,656 4,163 4,128 4,793 4,429 4,846 5,198 5,109 4,938 5,259 6,154 OPM % 19% 19% 18% 21% 19% 21% 20% 19% 17% 17% 18% 16% 17% Other Income + 1,386 502 790 674 228 1,194 1,468 1,404 2,028 1,832 1,570 2,671 1,788 Interest 2 23 1 1 6 1 1 1 4 3 7 9 27 Depreciation 124 147 168 181 267 307 307 315 266 246 259 270 280 Profit before tax 4,438 4,013 4,277 4,655 4,083 5,679 5,588 5,933 6,956 6,692 6,241 7,652 7,636 Tax % 23% 25% 29% 31% 31% 28% 27% 29% 29% 22% 22% 19% Net Profit 3,455 3,048 3,133 3,380 3,026 4,061 4,079 4,219 4,928 5,212 4,857 6,166 5,882 EPS in Rs 119.39 105.35 108.26 116.82 104.56 140.35 140.98 145.80 170.29 180.11 167.85 213.08 204.41 Dividend Payout % 34% 43% 42% 43% 48% 39% 39% 41% 35% 67% 83% 66%
Compounded Sales Growth 10 Years: 5% 5 Years: 9% 3 Years: 3% TTM: 5%
Compounded Profit Growth 10 Years: 6% 5 Years: 6% 3 Years: 5% TTM: -2%
Stock Price CAGR 10 Years: 9% 5 Years: 7% 3 Years: 25% 1 Year: 6%
Return on Equity 10 Years: 25% 5 Years: 21% 3 Years: 21% Last Year: 19%
Balance Sheet
Consolidated Figures in Rs. Crores / View Standalone CORPORATE ACTIONS
Mar 2011 Mar 2012 Mar 2013 Mar 2014 Mar 2015 Mar 2016 Mar 2017 Mar 2018 Mar 2019 Mar 2020 Mar 2021 Mar 2022 Sep 2022 Share Capital + 289 289 289 289 289 289 289 289 289 289 289 289 284 Reserves 4,518 5,792 7,776 9,878 10,806 13,731 17,567 20,136 22,944 21,373 26,984 29,570 25,753 Borrowings + 347 150 116 59 112 118 120 121 125 126 121 123 124 Other Liabilities + 3,994 4,894 4,461 5,081 4,758 3,102 3,661 4,595 5,476 4,722 6,207 5,129 6,356 Total Liabilities 9,149 11,126 12,642 15,308 15,966 17,240 21,638 25,141 28,834 26,510 33,602 35,111 32,516 Fixed Assets + 1,855 1,920 2,355 2,660 2,448 2,026 2,002 1,878 1,764 1,699 1,668 1,836 1,787 CWIP 70 42 294 144 255 52 42 56 48 60 16 77 222 Investments 4,211 4,473 6,059 8,448 8,985 11,067 15,477 18,895 20,603 19,914 24,687 26,634 22,786 Other Assets + 3,013 4,692 3,934 4,056 4,277 4,095 4,117 4,312 6,420 4,837 7,232 6,564 7,721 Total Assets 9,149 11,126 12,642 15,308 15,966 17,240 21,638 25,141 28,834 26,510 33,602 35,111 32,516