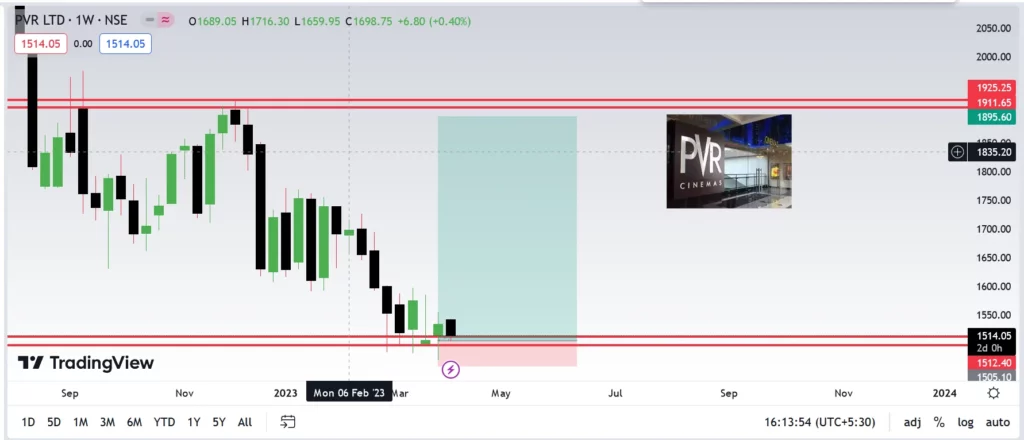
Most brokerage houses stay optimistic about the stock in light of the combined PVR-INOX, which has a share of 43% in multiplex screens and 50%+ in multiplex box office, an improving slate of Hindi films, and a solid pipeline for the entire film industry in FY24. Following the company’s first investor conference following the merger, shares of PVR rose as much as 3% during the day, reaching $1,574.95 per share. On Wednesday, the price increased by 0.94 percent to $1,542.05 per share.
Let us look at the Fundamentals
Profit & Loss
Consolidated Figures in Rs. Crores / View StandalonePRODUCT SEGMENTS
Mar 2011
Mar 2012
Mar 2013
Mar 2014
Mar 2015
Mar 2016
Mar 2017
Mar 2018
Mar 2019
Mar 2020
Mar 2021
Mar 2022
TTM
Sales +
459
518
806
1,348
1,477
1,850
2,119
2,334
3,086
3,414
280
1,331
3,146
Expenses +
370
441
688
1,133
1,271
1,551
1,799
1,933
2,499
2,338
616
1,225
2,262
Operating Profit
90
76
119
215
206
299
320
401
587
1,076
-336
106
884
OPM %
20%
15%
15%
16%
14%
16%
15%
17%
19%
32%
-120%
8%
28%
Other Income +
10
10
6
11
2
45
52
30
32
38
469
326
100
Interest
16
18
37
80
78
84
81
84
128
482
498
498
508
Depreciation
67
36
56
94
117
115
138
154
191
542
575
614
626
Profit before tax
16
31
32
52
12
145
153
194
299
90
-939
-681
-150
Tax %
98%
18%
-39%
4%
7%
32%
37%
36%
37%
70%
20%
28%
Net Profit
0
25
44
50
12
99
96
124
189
27
-748
-489
-108
EPS in Rs
2.80
9.08
10.47
12.71
2.86
19.58
19.08
24.84
37.81
4.95
-123.07
-80.04
-17.56
Dividend Payout %
33%
61%
9%
18%
33%
10%
10%
8%
5%
75%
0%
0%
Compounded Sales Growth
10 Years:
10%
5 Years:
-9%
3 Years:
-24%
TTM:
223%
Compounded Profit Growth
10 Years:
%
5 Years:
%
3 Years:
%
TTM:
84%
Stock Price CAGR
10 Years:
18%
5 Years:
4%
3 Years:
15%
1 Year:
-21%
Return on Equity
10 Years:
-6%
5 Years:
-13%
3 Years:
-26%
Last Year:
-32%
Balance Sheet
Consolidated Figures in Rs. Crores / View StandaloneCORPORATE ACTIONS