Learning sharks-Share Market Institute


Rajouri Garden  8595071711 7982037049  Noida 8920210950 , and  Paschim Vihar  7827445731  

Fee revision notice effective 1st April 2025; No change for students enrolled before 15th May 2025

Download “Key features of Budget 2024-2025here

Bodal Chemical Share Price Analysis-Is it a risky investment?

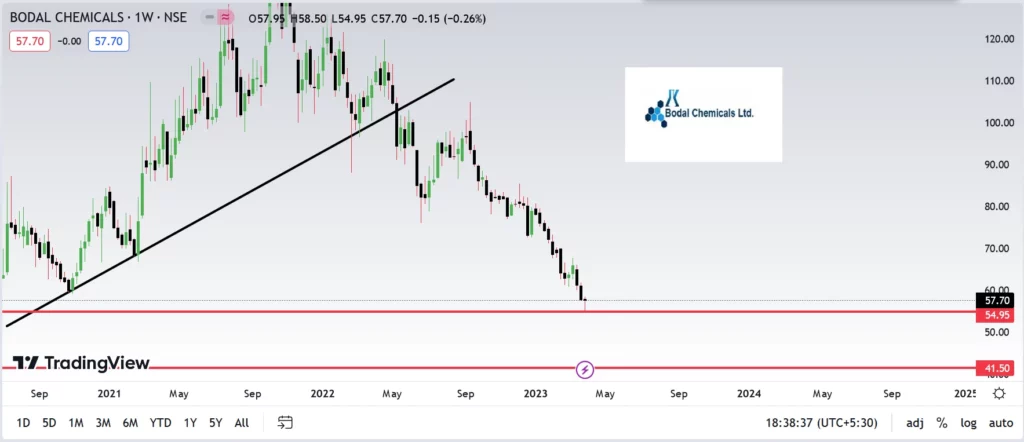
As you can see Bodal Chemicals is currently trading at Rs 57.70 but our experts suggest to wait till it goes above 60 and for the downside one can take position at Rs41.50.

The latest balance sheet data shows that Bodal Chemicals had liabilities of ₹8.04b due within a year, and liabilities of ₹2.66b falling due after that. On the other hand, it had cash of ₹151.5m and ₹5.95b worth of receivables due within a year. So its liabilities outweigh the sum of its cash and (near-term) receivables by ₹4.59b.

Bodal Chemicals has a market capitalization of ₹11.7b, so it could very likely raise cash to ameliorate its balance sheet, if the need arose. But it’s clear that we should definitely closely examine whether it can manage its debt without dilution.

Let us look at the Fundamentals

Profit & Loss

Consolidated Figures in Rs. Crores / View Standalone

Mar 2011Mar 2012Mar 2013Mar 2014Mar 2015Mar 2016Mar 2017Mar 2018Mar 2019Mar 2020Mar 2021Mar 2022TTM
Sales +5736145279601,0439081,2331,1421,4241,3751,2262,0511,768
Expenses +5126105087708597581,0079461,1871,2371,1401,8311,608
Operating Profit6142018918415022619623613887220160
OPM %11%1%4%20%18%16%18%17%17%10%7%11%9%
Other Income +164-70519158131016-110
Interest23354047271295919172936
Depreciation14161625222629122128304750
Profit before tax25-41-33471391312041862191015514284
Tax %33%27%30%35%34%34%35%33%35%15%28%31%
Net Profit17-30-2330928613312214186409964
EPS in Rs1.67-2.73-2.122.768.417.8812.1810.0311.727.123.438.795.50
Dividend Payout %32%0%0%0%0%8%7%8%7%11%23%9%
Compounded Sales Growth
10 Years:13%
5 Years:11%
3 Years:13%
TTM:-6%
Compounded Profit Growth
10 Years:18%
5 Years:-4%
3 Years:-8%
TTM:-38%
Stock Price CAGR
10 Years:26%
5 Years:-16%
3 Years:11%
1 Year:-47%
Return on Equity
10 Years:17%
5 Years:12%
3 Years:8%
Last Year:11%

Balance Sheet

Consolidated Figures in Rs. Crores / View StandaloneCORPORATE ACTIONS

Mar 2011Mar 2012Mar 2013Mar 2014Mar 2015Mar 2016Mar 2017Mar 2018Mar 2019Mar 2020Mar 2021Mar 2022Sep 2022
Share Capital +20223747472222242524242425
Reserves483613431352133416738059079571,0311,049
Borrowings +259345348372209143151181171257454676644
Other Liabilities +22217290156169132193194290267314382357
Total Liabilities5495754735935345107071,0721,2901,4551,7492,1132,074
Fixed Assets +272279265168190192222437609656804817803
CWIP1209309192671470274
Investments101122171763600
Other Assets +2752942074153393164595996507899241,227997
Total Assets5495754735935345107071,0721,2901,4551,7492,1132,074