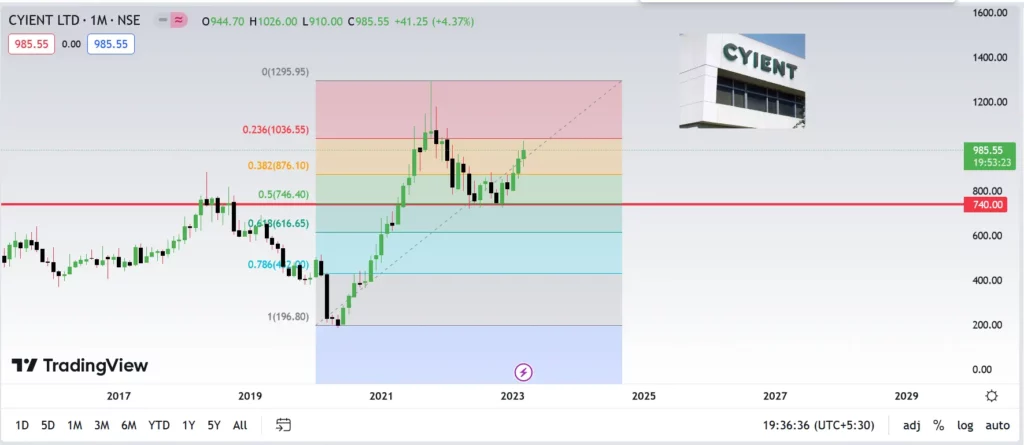
Cyient got a buy signal from HDFC Securities with a target price of Rs 1030. Cyient Ltd. is currently valued at Rs 961.9 on the open market.
A Mid Cap business with a market cap of Rs 10817.57 Crore, Cyient Ltd. was established in 1991 and works in the IT Software industry.Financials For the three months that concluded on December 31, 2022, the firm recorded consolidated total income of Rs 1645.70 crore, up 36.52% from the same period last year and up 16.23% from the previous quarter’s total income of Rs 1415.90 crore. In the most recent quarter, the company generated a net profit after tax of Rs. 156.00 Crore.
Let us look at the Fundamentals
Profit & Loss
Consolidated Figures in Rs. Crores / View StandalonePRODUCT SEGMENTS
Mar 2011
Mar 2012
Mar 2013
Mar 2014
Mar 2015
Mar 2016
Mar 2017
Mar 2018
Mar 2019
Mar 2020
Mar 2021
Mar 2022
TTM
Sales +
1,188
1,553
1,873
2,206
2,736
3,094
3,586
3,914
4,618
4,427
4,132
4,534
5,446
Expenses +
1,008
1,284
1,531
1,796
2,335
2,680
3,109
3,394
3,985
3,881
3,557
3,717
4,552
Operating Profit
180
269
342
410
401
414
477
520
633
546
575
818
894
OPM %
15%
17%
18%
19%
15%
13%
13%
13%
14%
12%
14%
18%
16%
Other Income +
29
16
36
17
122
112
79
147
131
158
140
112
100
Interest
1
1
0
1
6
16
17
20
33
49
43
39
84
Depreciation
49
49
64
72
71
89
95
105
111
188
194
192
227
Profit before tax
160
235
315
354
446
421
444
541
620
468
477
698
682
Tax %
17%
36%
31%
29%
25%
24%
24%
26%
23%
27%
24%
25%
Net Profit
140
161
231
266
351
320
340
403
477
341
364
522
505
EPS in Rs
12.55
14.48
20.70
23.76
31.43
28.94
30.54
36.00
42.33
31.14
33.06
47.35
45.78
Dividend Payout %
10%
17%
22%
21%
25%
24%
34%
36%
35%
48%
51%
51%
Compounded Sales Growth
10 Years:
11%
5 Years:
5%
3 Years:
-1%
TTM:
22%
Compounded Profit Growth
10 Years:
12%
5 Years:
8%
3 Years:
3%
TTM:
11%
Stock Price CAGR
10 Years:
19%
5 Years:
7%
3 Years:
66%
1 Year:
8%
Return on Equity
10 Years:
17%
5 Years:
16%
3 Years:
15%
Last Year:
17%
Balance Sheet
Consolidated Figures in Rs. Crores / View StandaloneCORPORATE ACTIONS