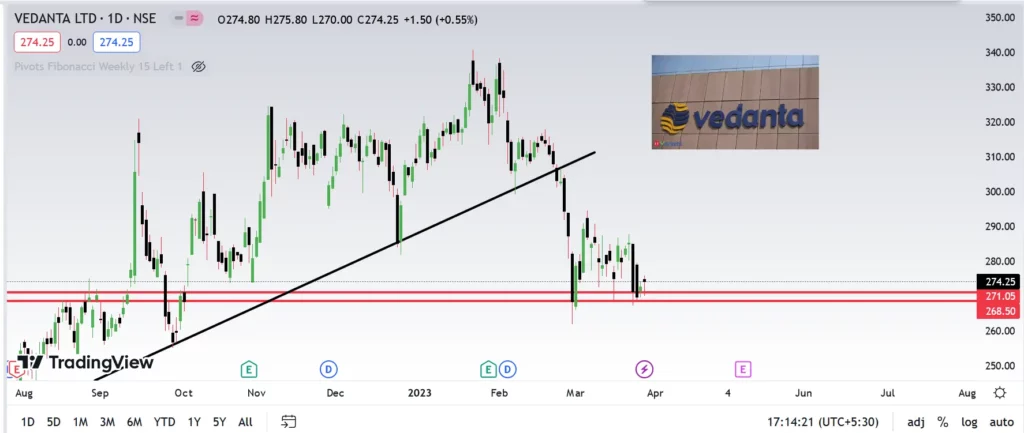
Vedanta Ltd., incorporated in the year 1965, is a Large Cap company (having a market cap of Rs 101,386.60 Crore) operating in Diversified sector.Vedanta stock is currently at its support but we suggest to wait till it cross 280 level for buy.
Lets us look at the Fundamentals Profit & Loss
Consolidated Figures in Rs. Crores / View Standalone
Mar 2011 Mar 2012 Mar 2013 Mar 2014 Mar 2015 Mar 2016 Mar 2017 Mar 2018 Mar 2019 Mar 2020 Mar 2021 Mar 2022 TTM
10,136 8,978 2,749 66,152 73,710 64,262 72,225 91,866 92,048 84,447 88,021 132,732 149,200
5,008 5,478 2,283 46,557 51,595 82,741 50,849 66,989 68,877 63,704 60,703 87,908 110,604 Operating Profit 5,129 3,500 465 19,595 22,114 -18,479 21,376 24,877 23,171 20,743 27,318 44,824 38,596 OPM % 51% 39% 17% 30% 30% -29% 30% 27% 25% 25% 31% 34% 26%
615 168 33 1,874 -19,222 4,290 4,423 6,087 4,270 -14,932 2,743 1,832 3,277 Interest 87 433 475 5,094 5,659 5,778 5,855 5,112 5,689 4,977 5,210 4,797 5,753 Depreciation 96 106 197 6,882 7,159 8,572 6,292 6,283 8,192 9,093 7,638 8,895 10,187 Profit before tax 5,560 3,129 -174 9,493 -9,925 -28,540 13,652 19,569 13,560 -8,259 17,213 32,964 25,933 Tax % 24% 33% 25% -9% -15% 37% 17% 30% 28% 43% 13% 28% Net Profit 4,222 2,696 2,280 11,421 -11,369 -17,862 11,316 13,692 9,698 -4,744 15,032 23,710 18,632 EPS in Rs 48.58 31.01 26.24 21.25 -52.77 -41.39 23.47 27.82 19.01 -17.93 31.21 50.58 38.98 Dividend Payout % 7% 13% 0% 15% -8% -8% 83% 76% 99% -22% 30% 89%
Compounded Sales Growth 10 Years: 31% 5 Years: 13% 3 Years: 13% TTM: 23%
Compounded Profit Growth 10 Years: 22% 5 Years: 29% 3 Years: 40% TTM: -29%
Stock Price CAGR 10 Years: 6% 5 Years: 0% 3 Years: 63% 1 Year: -34%
Return on Equity 10 Years: 13% 5 Years: 20% 3 Years: 25% Last Year: 30%
Balance Sheet
Consolidated Figures in Rs. Crores / View Standalone
Mar 2011 Mar 2012 Mar 2013 Mar 2014 Mar 2015 Mar 2016 Mar 2017 Mar 2018 Mar 2019 Mar 2020 Mar 2021 Mar 2022 Sep 2022
87 87 87 296 296 296 372 372 372 374 374 374 372 Reserves 12,724 15,031 17,388 72,712 53,579 43,743 60,128 62,940 61,925 54,263 61,906 65,011 53,867
999 3,741 4,839 80,566 77,752 67,778 71,569 58,159 66,226 59,185 57,667 53,581 59,020
1,787 1,542 723 60,545 58,654 80,163 64,952 58,896 70,045 66,917 63,551 75,201 88,824 Total Liabilities 15,597 20,401 23,037 214,120 190,281 191,980 196,946 180,367 198,568 180,737 183,496 194,165 202,083
2,416 3,307 4,136 87,205 70,108 61,591 75,631 78,455 86,327 86,127 88,002 89,498 95,979 CWIP 544 837 723 43,128 38,748 38,461 27,557 32,055 24,959 18,585 16,314 15,879 17,060 Investments 8,800 14,167 16,059 37,910 39,606 53,386 46,962 28,700 33,065 24,753 16,660 17,291 14,742
3,838 2,090 2,119 45,877 41,819 38,542 46,796 41,157 54,217 51,272 62,520 71,497 74,302 Total Assets 15,597 20,401 23,037 214,120 190,281 191,980 196,946 180,367 198,568 180,737 183,496 194,165 202,083