As of 12:423 IST on the NSE, Hindustan Copper Ltd. is trading at Rs 123.70, up 3.33% on the day. The stock has lost 30% in the last year but has recovered from the price. Sensex Today Live 59763.31 | Nifty Live 17825.1 – Indian Share Market Live, Stock Market News | Learning sharks
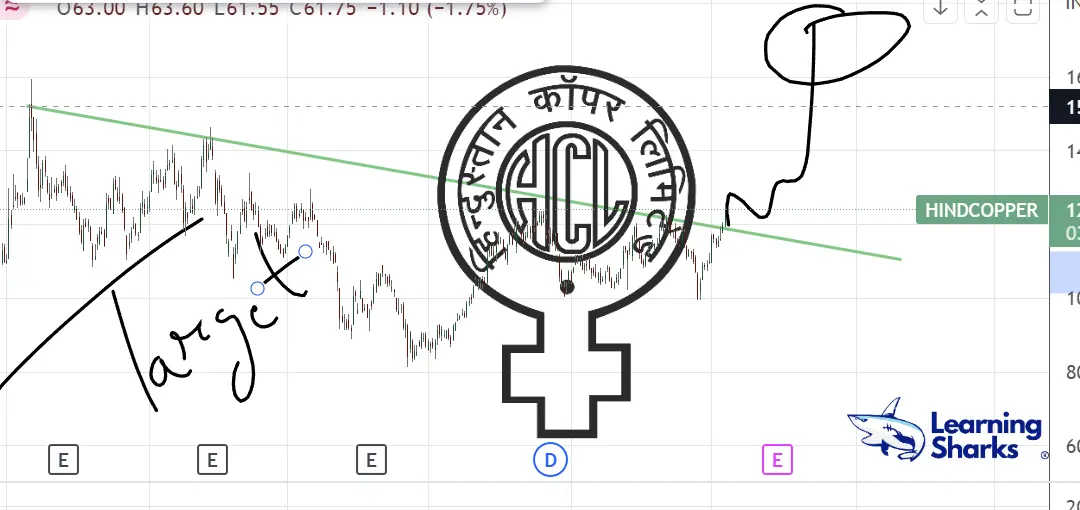
Let’s look at the technicals of the stock, The stock seems to be breaking the resistance level of Rs117 with the target up to Rs 162 a piece.
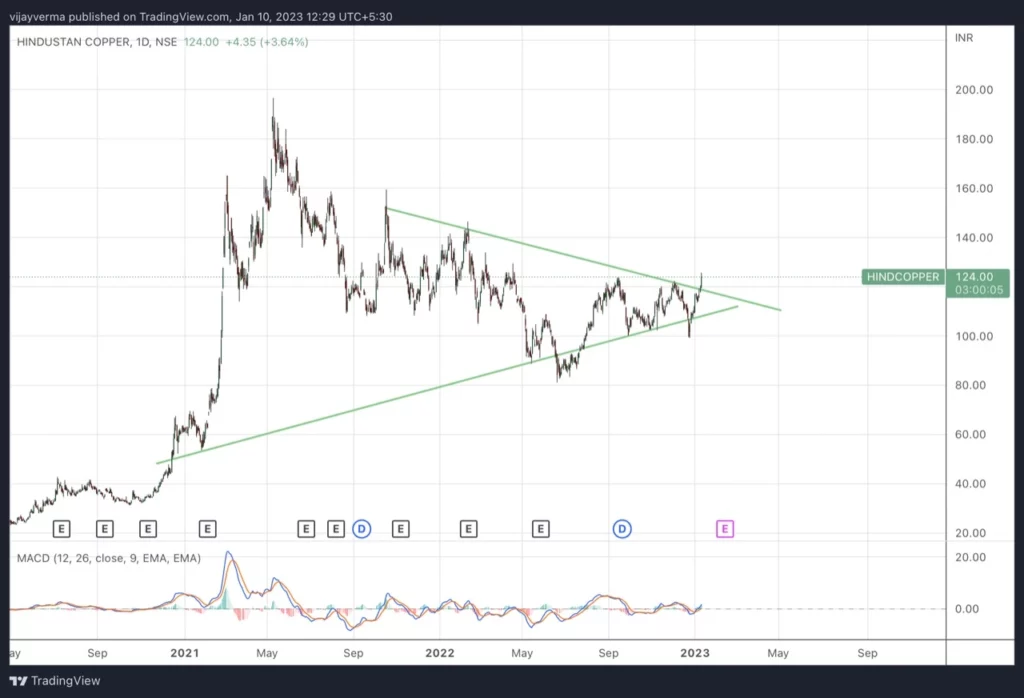
The stock seems to be coming out of its symmetrical triangle pattern. This could push the price to a new high. While we are discussing the technicals of this stock. Let’s check out the fundamentals of this share price as well.
Profit & Loss
Standalone Figures in Rs. Crores / View Consolidated
| Mar 2011 | Mar 2012 | Mar 2013 | Mar 2014 | Mar 2015 | Mar 2016 | Mar 2017 | Mar 2018 | Mar 2019 | Mar 2020 | Mar 2021 | Mar 2022 | TTM | |
|---|---|---|---|---|---|---|---|---|---|---|---|---|---|
| Sales + | 1,171 | 1,485 | 1,323 | 1,489 | 1,016 | 1,072 | 1,204 | 1,670 | 1,816 | 832 | 1,787 | 1,822 | 1,650 |
| Expenses + | 788 | 952 | 1,020 | 984 | 888 | 962 | 981 | 1,399 | 1,310 | 1,074 | 1,376 | 1,310 | 1,176 |
| Operating Profit | 383 | 534 | 303 | 505 | 128 | 110 | 223 | 271 | 506 | -242 | 411 | 512 | 474 |
| OPM % | 33% | 36% | 23% | 34% | 13% | 10% | 18% | 16% | 28% | -29% | 23% | 28% | 29% |
| Other Income + | 53 | 85 | 257 | 102 | 67 | 52 | 27 | 41 | 37 | 57 | 35 | 50 | 60 |
| Interest | 4 | 2 | 6 | 2 | 1 | 3 | 14 | 26 | 60 | 62 | 64 | 30 | 18 |
| Depreciation | 97 | 144 | 151 | 174 | 113 | 119 | 142 | 165 | 253 | 291 | 295 | 150 | 177 |
| Profit before tax | 335 | 473 | 404 | 431 | 80 | 40 | 94 | 122 | 230 | -538 | 87 | 382 | 339 |
| Tax % | 33% | 32% | 12% | 33% | 16% | 5% | 34% | 35% | 37% | -6% | -26% | 2% | |
| Net Profit | 224 | 323 | 356 | 286 | 68 | 38 | 62 | 80 | 146 | -569 | 110 | 374 | 344 |
| EPS in Rs | 2.42 | 3.50 | 3.84 | 3.10 | 0.73 | 0.41 | 0.67 | 0.86 | 1.57 | -6.15 | 1.19 | 3.87 | 3.56 |
| Dividend Payout % | 41% | 29% | 26% | 32% | 21% | 0% | 30% | 29% | 33% | 0% | 29% | 30% |
| Compounded Sales Growth | |
|---|---|
| 10 Years: | 2% |
| 5 Years: | 9% |
| 3 Years: | 0% |
| TTM: | -8% |
| Compounded Profit Growth | |
|---|---|
| 10 Years: | 2% |
| 5 Years: | 43% |
| 3 Years: | 37% |
| TTM: | 86% |
| Stock Price CAGR | |
|---|---|
| 10 Years: | -2% |
| 5 Years: | 5% |
| 3 Years: | 37% |
| 1 Year: | -9% |
| Return on Equity | |
|---|---|
| 10 Years: | 6% |
| 5 Years: | 2% |
| 3 Years: | -2% |
| Last Year: | 25% |
Shareholding Pattern
Numbers in percentages
| Dec 2019 | Mar 2020 | Jun 2020 | Sep 2020 | Dec 2020 | Mar 2021 | Jun 2021 | Sep 2021 | Dec 2021 | Mar 2022 | Jun 2022 | Sep 2022 | |
|---|---|---|---|---|---|---|---|---|---|---|---|---|
| Promoters + | 76.05 | 76.05 | 76.05 | 76.05 | 76.05 | 76.05 | 72.76 | 66.14 | 66.14 | 66.14 | 66.14 | 66.14 |
| FIIs + | 0.20 | 0.19 | 0.14 | 0.12 | 0.41 | 0.71 | 1.14 | 1.07 | 0.26 | 0.31 | 0.67 | 1.32 |
| DIIs + | 13.70 | 13.65 | 13.64 | 13.59 | 13.31 | 12.66 | 13.02 | 17.02 | 16.80 | 16.44 | 15.61 | 15.95 |
| Public + | 10.06 | 10.11 | 10.18 | 10.24 | 10.24 | 10.58 | 13.08 | 15.77 | 16.79 | 17.10 | 17.58 | 16.59 |
CONCLUSION
Overall, the stock seems to be in the buying zone with targets of up to 20%. One can take an entry to fetch some profits. This is for educational purposes, not a buying call.
To know more about stock market courses, visit our course page
#stockmarket #hindcopper #hindustancopper #sharemarket #price