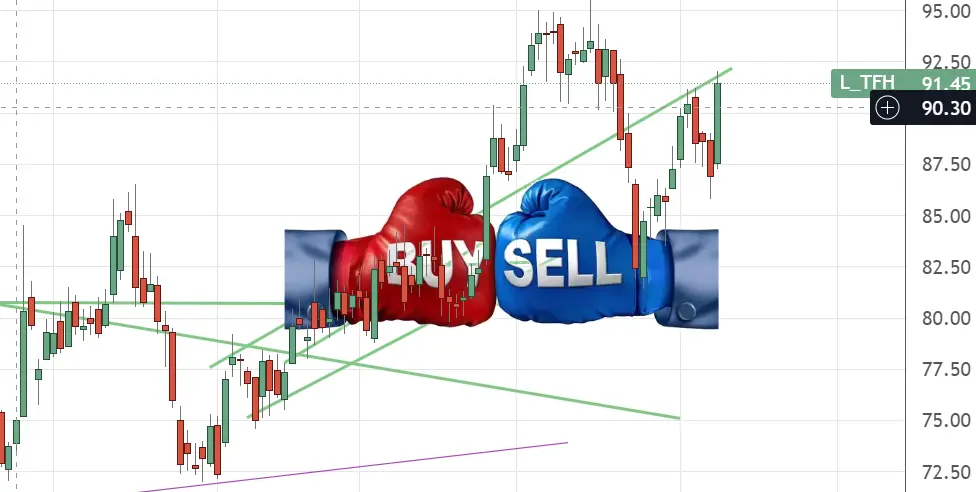
If you missed the previous buying call then check out this breakout. The finance holding company which rose 5% today is none other than one of the optimistic LT finance holdings limited companies
The CMP of the share is 91.80 INR+4.90 (5.64%)today. The stock has broken its resistance and is currently trading in the above resistance area. According to the technicals of the stock. L&T finance holdings is a buy with targets of up to 20%.
Let’s look at the technicals of this stock on the chart.
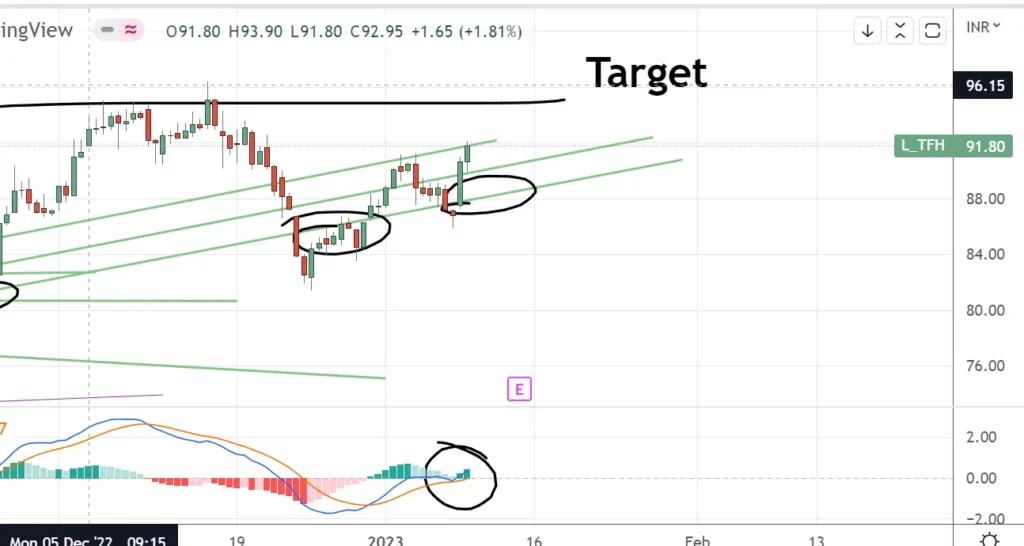
Overall, according to the Support resistance, and MACD. it’s a Buy. However, let’s look at the fundamentals of this stock too.
Profit & Loss
Consolidated Figures in Rs. Crores / View StandalonePRODUCT SEGMENTS
| Mar 2011 | Mar 2012 | Mar 2013 | Mar 2014 | Mar 2015 | Mar 2016 | Mar 2017 | Mar 2018 | Mar 2019 | Mar 2020 | Mar 2021 | Mar 2022 | TTM | |
|---|---|---|---|---|---|---|---|---|---|---|---|---|---|
| Sales + | 2,114 | 3,004 | 3,990 | 5,221 | 6,456 | 7,440 | 8,532 | 10,215 | 13,365 | 14,104 | 13,353 | 11,930 | 12,044 |
| Expenses + | 421 | 539 | 1,025 | 1,230 | 1,625 | 1,979 | 2,776 | 3,308 | 3,377 | 4,160 | 5,401 | 5,233 | 5,152 |
| Operating Profit | 1,693 | 2,464 | 2,965 | 3,991 | 4,831 | 5,461 | 5,756 | 6,907 | 9,944 | 7,952 | 6,697 | 6,892 | |
| OPM % | 80% | 82% | 74% | 76% | 75% | 73% | 67% | 68% | 75% | 70% | 60% | 56% | 57% |
| Other Income + | -9 | -13 | 419 | -5 | 16 | 8 | 26 | 49 | -4 | 370 | 836 | 594 | 703 |
| Interest | 1,021 | 1,707 | 2,330 | 3,081 | 3,577 | 4,133 | 4,635 | 5,458 | 6,882 | 7,552 | 7,230 | 5,765 | 5,651 |
| Depreciation | 59 | 60 | 65 | 80 | 96 | 83 | 67 | 52 | 50 | 82 | 86 | 103 | 106 |
| Profit before tax | 604 | 684 | 989 | 825 | 1,175 | 1,253 | 1,079 | 1,446 | 3,052 | 2,680 | 1,472 | 1,423 | 1,838 |
| Tax % | 35% | 34% | 26% | 28% | 28% | 32% | 3% | 12% | 27% | 37% | 36% | 26% | |
| Net Profit | 391 | 455 | 730 | 595 | 855 | 857 | 1,048 | 1,278 | 2,232 | 1,700 | 949 | 1,049 | 1,316 |
| EPS in Rs | 2.16 | 3.46 | 2.82 | 4.04 | 3.97 | 4.83 | 5.11 | 9.06 | 6.90 | 3.93 | 4.33 | 5.40 | |
| Dividend Payout % | 0% | 0% | 18% | 22% | 16% | 16% | 13% | 16% | 9% | 11% | 0% | 12% |
Balance Sheet
Consolidated Figures in Rs. Crores / View StandaloneCORPORATE ACTIONS
| Mar 2011 | Mar 2012 | Mar 2013 | Mar 2014 | Mar 2015 | Mar 2016 | Mar 2017 | Mar 2018 | Mar 2019 | Mar 2020 | Mar 2021 | Mar 2022 | Sep 2022 | |
|---|---|---|---|---|---|---|---|---|---|---|---|---|---|
| Share Capital + | 1,417 | 1,715 | 2,467 | 2,718 | 3,084 | 2,967 | 2,969 | 1,996 | 1,999 | 2,005 | 2,469 | 2,474 | 2,476 |
| Reserves | 1,474 | 3,038 | 3,753 | 4,107 | 4,656 | 5,324 | 6,020 | 9,411 | 11,450 | 12,688 | 16,304 | 17,474 | 17,955 |
| Borrowings + | 15,901 | 21,077 | 28,247 | 35,854 | 42,091 | 51,616 | 59,811 | 75,248 | 91,507 | 93,934 | 88,592 | 85,237 | 85,387 |
| Other Liabilities + | 784 | 1,103 | 2,852 | 3,182 | 4,275 | 5,107 | 4,924 | 1,117 | 1,094 | 902 | 1,582 | 1,696 | 1,837 |
| Total Liabilities | 19,577 | 26,933 | 36,570 | 44,861 | 52,742 | 63,799 | 72,511 | 87,772 | 106,050 | 109,529 | 108,947 | 106,880 | 107,655 |
| Fixed Assets + | 476 | 520 | 1,131 | 1,228 | 1,184 | 1,313 | 1,230 | 1,151 | 1,127 | 1,100 | 1,138 | 509 | 530 |
| CWIP | 18 | 33 | 89 | 140 | 174 | 22 | 28 | 19 | 39 | 62 | 24 | 22 | 0 |
| Investments | 732 | 770 | 1,843 | 2,730 | 2,649 | 3,563 | 6,012 | 5,301 | 8,641 | 5,979 | 8,872 | 11,917 | 11,135 |
| Other Assets + | 18,350 | 25,610 | 33,507 | 40,763 | 48,736 | 58,901 | 65,242 | 81,301 | 96,243 | 102,387 | 98,912 | 94,433 | 95,990 |
| Total Assets | 19,577 | 26,933 | 36,570 | 44,861 | 52,742 | 63,799 | 72,511 | 87,772 | 106,050 | 109,529 | 108,947 | 106,880 | 107,655 |
Shareholding Pattern
Numbers in percentages DEALS / TRADES
4 recently
| Dec 2019 | Mar 2020 | Jun 2020 | Sep 2020 | Dec 2020 | Mar 2021 | Jun 2021 | Sep 2021 | Dec 2021 | Mar 2022 | Jun 2022 | Sep 2022 | |
|---|---|---|---|---|---|---|---|---|---|---|---|---|
| Promoters + | 63.86 | 63.72 | 63.72 | 63.67 | 63.65 | 63.62 | 63.59 | 63.53 | 63.50 | 66.26 | 66.23 | 66.20 |
| FIIs + | 12.49 | 10.60 | 9.37 | 7.07 | 9.36 | 10.60 | 8.79 | 8.25 | 7.86 | 6.91 | 6.61 | 6.75 |
| DIIs + | 4.44 | 5.22 | 5.45 | 4.98 | 5.27 | 5.88 | 6.57 | 6.57 | 6.11 | 4.57 | 5.34 | 5.35 |
| Public + | 19.21 | 20.46 | 21.46 | 24.28 | 21.72 | 19.91 | 21.05 | 21.66 | 22.53 | 22.26 | 21.82 | 21.69 |
CONCLUSION
Overall, the stock is under the buying zone. We recommend any new investors add this to their portfolio. However, this is an education opinion, not a professional call. If you wanna learn more about our stock market courses, then visit our courses section.