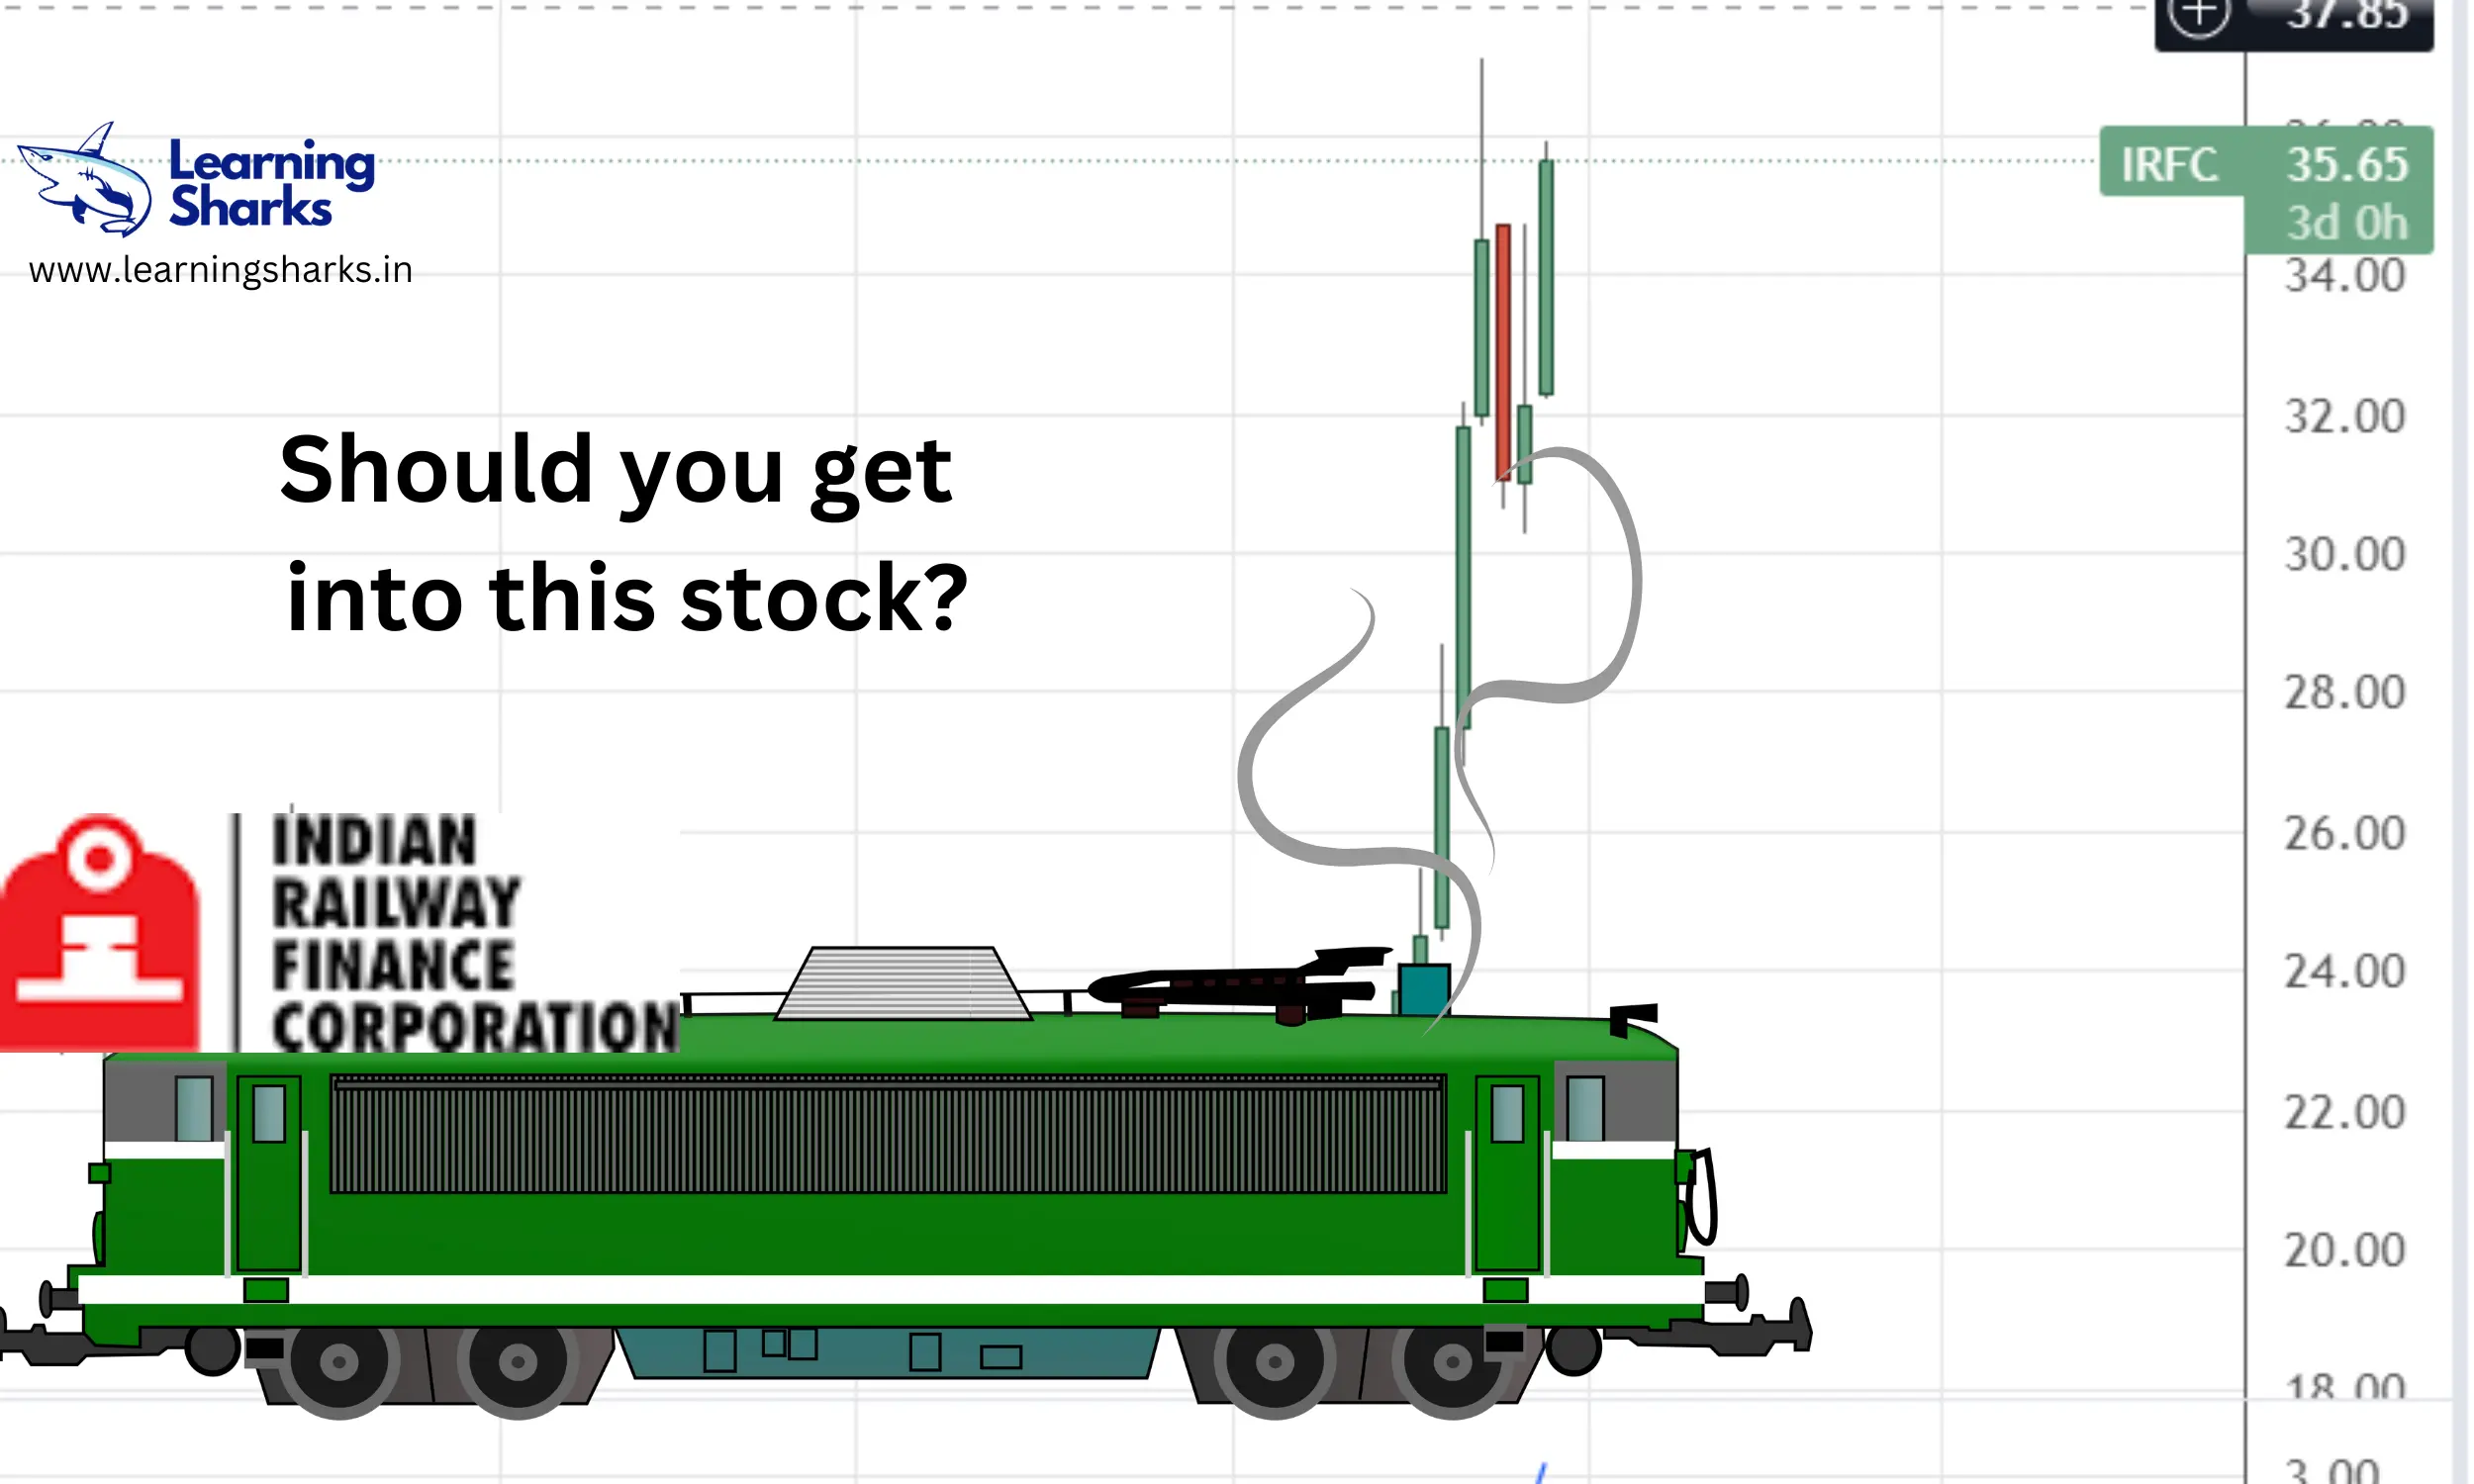
Share price of IRFC NSE Target: On Tuesday, December 20, despite a generally bearish market, the share price of Indian Railway Finance Corporation (IRFC) soared 9%. The PSU stock has experienced recent volatility as profit-taking has dropped the price more than 20% from its 52-week high of Rs. 37.10, which it reached on November 30.
The benchmark indices declined in opening trade as a result of subpar global cues, but the stock opened in the green at Rs 32.95 per share on NSE, up slightly from the previous close of Rs 32.85. In today’s session, the Indian Railways stock experienced strong momentum and strong volume as strong buying propelled it to the day’s high of Rs 35.95, soaring 9%.
According to NSE data as of 3:18 PM, 16,16,33,418 shares of IRFC were traded during today’s trade.
Let’s look at the fundamentals of the stock.
Profit & Loss
Figures in Rs. Crores
| Mar 2012 | Mar 2013 | Mar 2014 | Mar 2015 | Mar 2016 | Mar 2017 | Mar 2018 | Mar 2019 | Mar 2020 | Mar 2021 | Mar 2022 | TTM | |
|---|---|---|---|---|---|---|---|---|---|---|---|---|
| Sales + | 4,642 | 5,550 | 6,197 | 6,939 | 7,507 | 9,047 | 9,267 | 11,134 | 13,421 | 15,771 | 20,299 | 22,465 |
| Expenses + | 9 | 22 | 19 | 34 | 38 | 26 | 38 | 48 | 66 | 113 | 123 | 148 |
| Operating Profit | 4,633 | 5,528 | 6,178 | 6,905 | 7,468 | 9,021 | 9,229 | 11,085 | 13,355 | 15,657 | 20,177 | 22,317 |
| OPM % | 100% | 100% | 100% | 100% | 99% | 100% | 100% | 100% | 100% | 99% | 99% | 99% |
| Other Income + | 1 | 2 | 1 | 1 | 1 | 0 | 1 | -0 | 0 | 0 | 2 | 3 |
| Interest | 3,620 | 4,075 | 4,607 | 4,992 | 5,519 | 6,888 | 6,638 | 8,183 | 10,163 | 11,237 | 14,075 | 15,842 |
| Depreciation | 0 | 0 | 0 | 0 | 0 | 0 | 0 | 0 | 0 | 4 | 14 | 15 |
| Profit before tax | 1,013 | 1,454 | 1,572 | 1,914 | 1,950 | 2,133 | 2,592 | 2,902 | 3,192 | 4,416 | 6,090 | 6,463 |
| Tax % | 53% | 64% | 55% | 60% | 56% | 56% | 21% | 22% | 0% | 0% | 0% | |
| Net Profit | 481 | 522 | 701 | 758 | 849 | 934 | 2,055 | 2,255 | 3,192 | 4,416 | 6,090 | 6,462 |
| EPS in Rs | 2.69 | 3.38 | 4.66 | 4.94 | ||||||||
| Dividend Payout % | 21% | 21% | 6% | 20% | 40% | 40% | 18% | 18% | 0% | 31% | 30% |
Balance Sheet
Figures in Rs. CroresCORPORATE ACTIONS
| Mar 2012 | Mar 2013 | Mar 2014 | Mar 2015 | Mar 2016 | Mar 2017 | Mar 2018 | Mar 2019 | Mar 2020 | Mar 2021 | Mar 2022 | Sep 2022 | |
|---|---|---|---|---|---|---|---|---|---|---|---|---|
| Share Capital + | 2,102 | 2,352 | 3,352 | 3,584 | 4,526 | 6,526 | 6,526 | 9,380 | 11,880 | 13,069 | 13,069 | 13,069 |
| Reserves | 3,049 | 3,442 | 3,978 | 4,555 | 4,999 | 5,483 | 7,402 | 15,648 | 18,419 | 22,845 | 27,928 | 30,481 |
| Borrowings + | 50,251 | 58,753 | 69,917 | 71,270 | 87,503 | 106,395 | 134,006 | 173,933 | 234,377 | 323,145 | 388,440 | 386,733 |
| Other Liabilities + | 4,674 | 6,208 | 6,683 | 8,238 | 11,372 | 11,245 | 13,534 | 7,642 | 10,828 | 21,423 | 20,544 | 34,915 |
| Total Liabilities | 60,076 | 70,755 | 83,930 | 87,647 | 108,400 | 129,650 | 161,468 | 206,604 | 275,504 | 380,482 | 449,980 | 465,198 |
| Fixed Assets + | 13 | 13 | 13 | 12 | 12 | 12 | 11 | 11 | 11 | 45 | 38 | 31 |
| CWIP | 0 | 0 | 0 | 0 | 0 | 0 | 0 | 0 | 0 | 0 | 0 | 0 |
| Investments | 15 | 13 | 11 | 9 | 8 | 8 | 14 | 13 | 12 | 12 | 10 | 10 |
| Other Assets + | 60,048 | 70,729 | 83,906 | 87,626 | 108,381 | 129,630 | 161,443 | 206,579 | 275,482 | 380,424 | 449,932 | 465,157 |
| Total Assets | 60,076 | 70,755 | 83,930 | 87,647 | 108,400 | 129,650 | 161,468 | 206,604 | 275,504 | 380,482 | 449,980 | 465,198 |
Shareholding Pattern
Numbers in percentages
| Mar 2021 | Jun 2021 | Sep 2021 | Dec 2021 | Mar 2022 | Jun 2022 | Sep 2022 | |
|---|---|---|---|---|---|---|---|
| Promoters + | 86.36 | 86.36 | 86.36 | 86.36 | 86.36 | 86.36 | 86.36 |
| FIIs + | 1.44 | 0.86 | 1.06 | 1.09 | 1.12 | 1.02 | 1.05 |
| DIIs + | 4.23 | 3.74 | 3.18 | 3.20 | 3.18 | 3.25 | 3.39 |
| Public + | 7.97 | 9.03 | 9.40 | 9.34 | 9.33 | 9.36 | 9.19 |
Overall, the share is nice however it will not be a multi-bagger. This is merely an educational opinion. and not investment advice.
#IFRC #SHAREPRICE