Traders use a variety of technical indicators to make educated conclusions about price direction and market activity. These indicators serve several functions, with the Moving Average Convergence Divergence (MACD) indicator being one of the most often used instruments for detecting price direction and momentum.
After all, finding a trend is a key priority in trading because that is where the greatest money is produced.
Let’s take a look at how the MACD indicator works and how you can use it to predict trend strength and direction.
What Does MACD Indicate?
Crypto traders can use the MACD indicator to discover a variety of critical market movements, such as divergences, crossovers, and overbought and oversold positions, which are significant indications in market research.
What Is the Working Principle of Moving Average Convergence Divergence?
The Moving Average Convergence Divergence (MACD) indicator assesses the relationship between two moving averages and can be visualised as a histogram that reveals price strengths and weaknesses.
Calculation of the MACD
You will almost certainly never need to manually compute the MACD indicator, but knowing how it is calculated will give you a better grasp of the indicator.
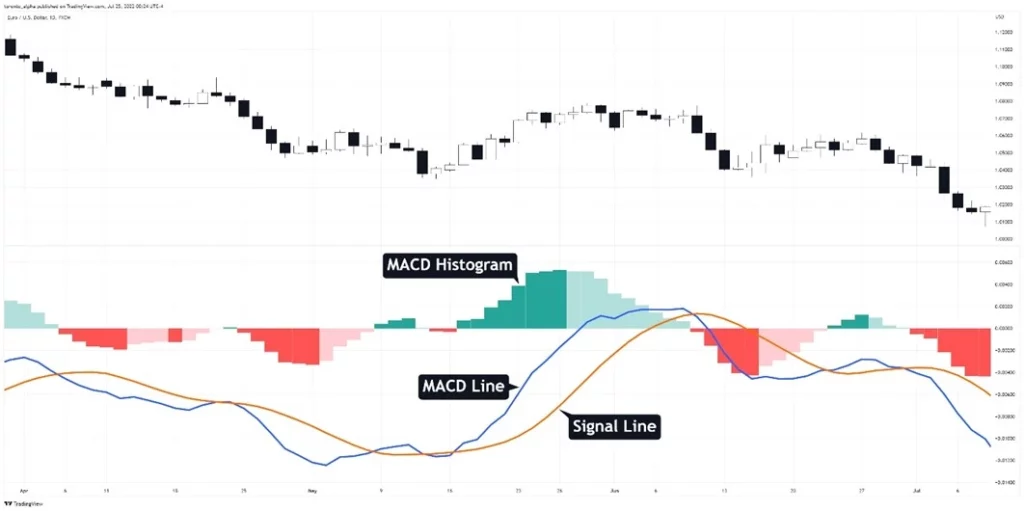
There are three parts to the MACD indicator:
The MACD Trend Line
The EMA is a moving average that emphasises recent price data, making it sensitive to price fluctuations and a useful tool for recognising trends and buying and selling indications.
The number of price points contained in a single measurement is referred to as the EMA period, and depending on the indicator, you will employ different EMA periods to detect distinct patterns.
The 26-period EMA is subtracted from the 12-period EMA, and the difference is shown on the chart beside a signal line.
Line of Signal
The signal line is a moving average of the MACD line, which smoothes out the MACD line.
A 9-period moving average (SMA or EMA are both prominent forms of moving averages used for this) is the most common signal line setting.
This will be explained in greater depth later in this essay.
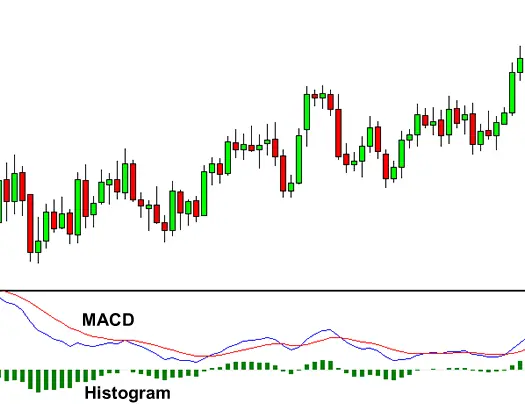
Histogram of MACD
The MACD histogram depicts the difference between the MACD line and the signal line as bars. The MACD line is above the signal line when the bars are above the zero line. When the bars are lower than the zero line, the MACD line is lower than the signal line.
Depending on your MACD approach, you may simply need to show the histogram and ignore the remainder of the indicator. Your platform’s indicator settings will allow you to preserve the histogram while removing the other lines if desired.
The Zero Line
In the MACD indicator, the zero line is a straight line that separates the positive and negative regions of the chart. The MACD line oscillates above and below the zero line to indicate whether the market is bullish or bearish.
If the histogram is above the zero line, the market is rising; if it is below the zero line, the market is falling.
How to Use MACD in Crypto Trading
How should you understand the MACD indicator’s signals? There are a number of useful methods for detecting the current market trend and spotting probable market reversal points.
1. MACD Bullish Trend
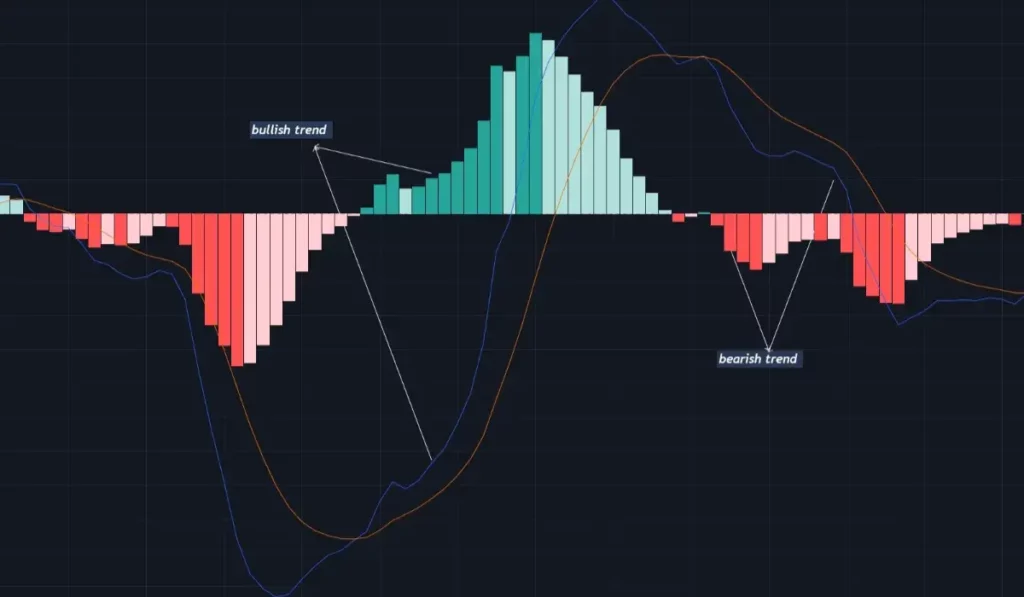
The trend is deemed bullish when the MACD line is above the signal line, and the further it is from the zero line, the stronger the trend. Traders can also use the histogram to forecast market trends.
When the histogram is above the zero line or green, the trend is bullish. Shorter histogram bars indicate a lesser trend, while longer bars suggest a stronger trend.
2.MACD’s Bearish Trend
In a negative trend, the MACD line remains below the signal line, and the greater the distance between them, the stronger the trend. The trend is bearish when the histograms are below the zero line. The length of the histogram bars can also indicate the trend’s strength.
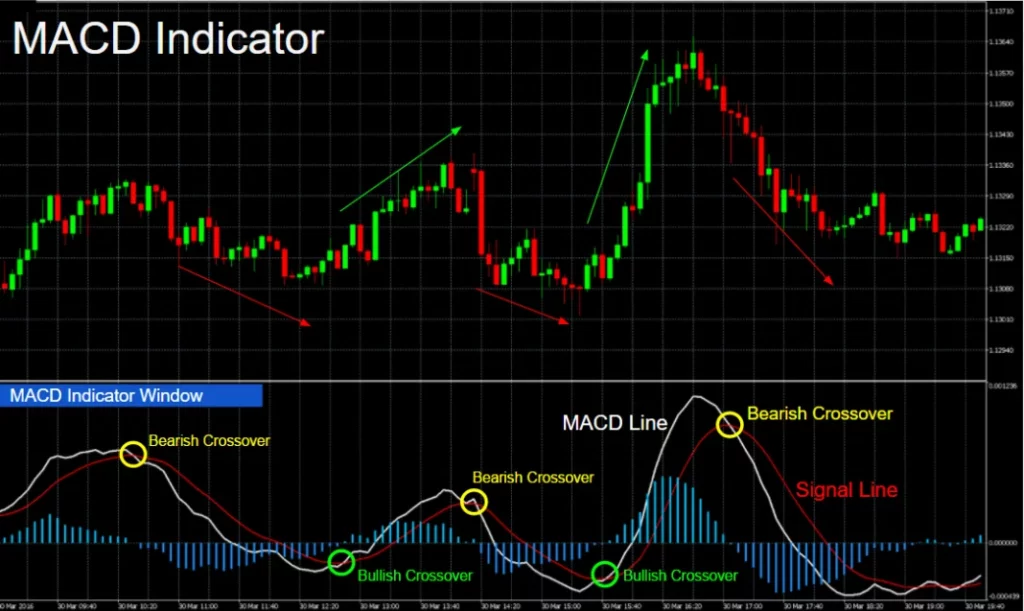
3.Crossover of the MACD
As the name implies, a trend reversal is a change in an ongoing trend. It denotes the point at which a previously bullish trend becomes bearish or vice versa.
Observing the crossover of the MACD and signal lines is a classic way for detecting a trend reversal. In a bearish trend, when the MACD line crosses above the signal line, it suggests a change to a positive trend.
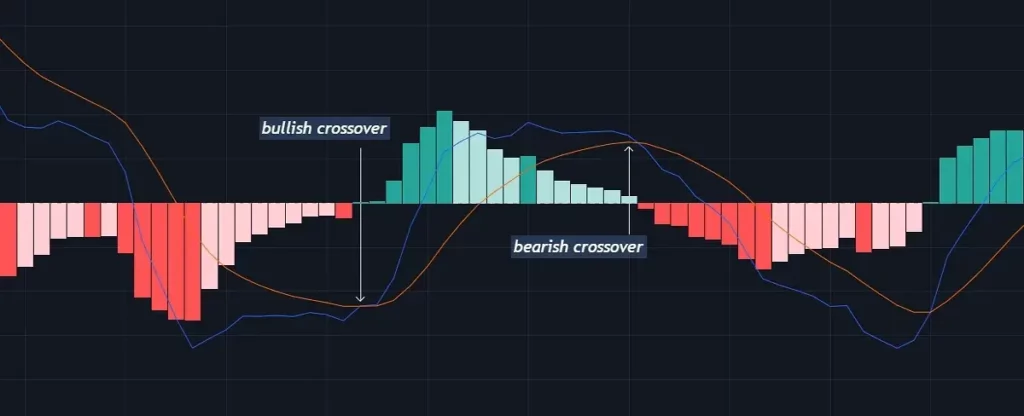
In contrast, the MACD line crossing below the signal line signals a bearish reversal, implying that the trend is likely to continue downward.
4.Conditions of Overbought and Oversold
Overbought and oversold conditions can be identified using the MACD indicator. When the MACD line is significantly higher than the signal line, the condition is called overbought.
An oversold position occurs when the MACD line is much lower than the signal line. These signals can be used by traders to join or exit positions based on their preferred trading strategy.
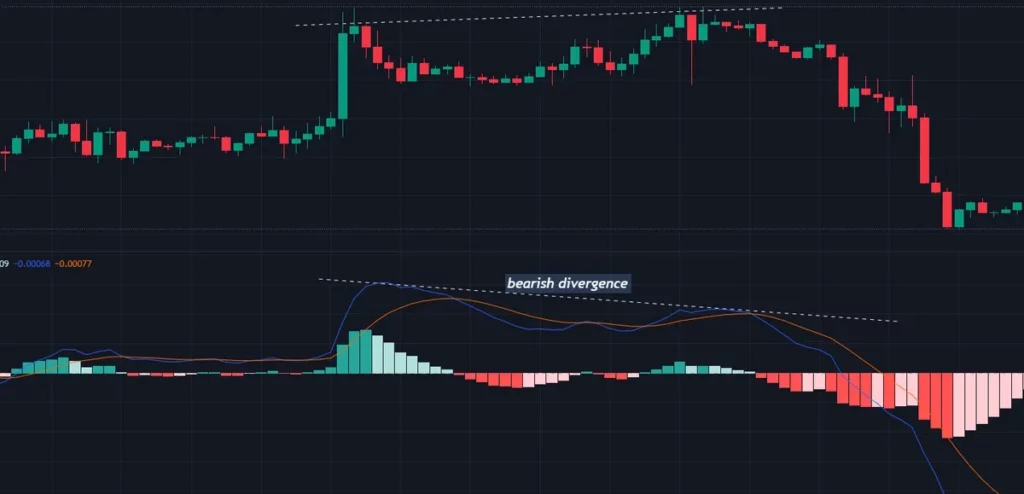
5.Price Disparity
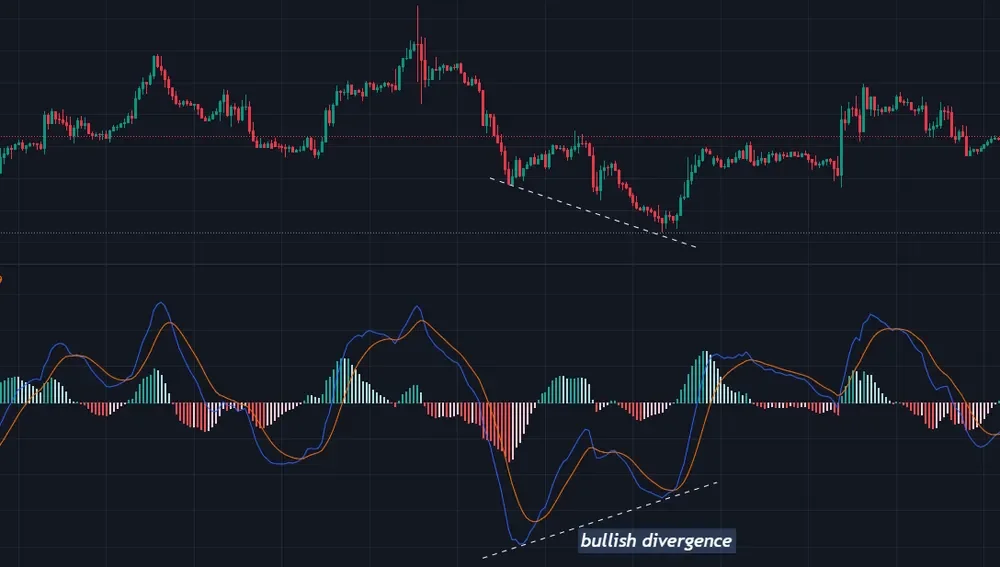
A price divergence from the MACD indicator can indicate a potential trend reversal. This happens when the price makes new highs or lows but the MACD does not. In a bullish divergence, for example, the price continues to fall and sets a new low, despite the fact that the associated MACD indicates otherwise.
The bearish divergence, on the other hand, indicates a deteriorating price action. When a divergence occurs, a probable reversal is approaching.
The MACD Indicator’s Limitations
It generates false signals, leading traders to believe that a trend reversal is coming, only for the trend to continue.
Moreover, price divergence, which MACD attempts to identify, may not always accurately predict a trend reversal, as price may continue in the ongoing direction.
Look at more info: https://learningsharks.in/
Follow us on insta” http://learningsharks