By examining statistical trends gleaned from trading activity, such as price movement and volume, technical analysis is a trading discipline used to assess investments and spot trading opportunities. Technical analysis focuses on the analysis of price and volume as opposed to fundamental analysis, which seeks to determine a security’s worth based on financial metrics like sales and earnings.
KEY TAKEAWAYS
- Technical analysis is a trading strategy used to assess financial investments and spot trading opportunities in price movements and chart patterns.
- According to technical analysts, a security’s previous trading activity and price changes can be useful predictors of the security’s future price moves.
- In contrast to technical analysis, which concentrates on recent price patterns and stock trends, fundamental analysis concentrates on the financials of a company.
Understanding Technical Analysis
The impact of supply and demand on changes in price, volume, and implied volatility is examined using technical analysis tools. It operates under the presumption that, when combined with suitable investing or trading rules, historical trading activity and price changes of a security can serve as valuable predictors of the security’s future price movements.
It can help improve the assessment of a security’s strength or weakness compared to the overall market or one of its sectors. It is frequently used to generate short-term trading signals using different charting tools. Analysts can refine their overall valuation estimate by using this information.
Charles Dow and his Dow Theory made technical analysis what it is today in the late 1800s.
William P. Hamilton, Robert Rhea, Edson Gould, and John Magee were among the notable researchers who added to the Dow Theory’s foundational ideas. Today’s technical analysis has progressed to incorporate a large number of patterns and signals that have been established through many years of study.
Using Technical Analysis
Technical analysis is frequently used in conjunction with other types of study by professional analysts. Retail traders may base their conclusions only on a security’s price charts and comparable data, but in practise, equity analysts rarely confine their research to just fundamental or technical analysis.
Any security with a trading history can benefit from technical analysis. Stocks, futures, commodities, fixed-income, currencies, and other assets are included in this. Technical analysis is actually much more common in the commodities and currency markets, where traders pay attention to short-term price changes.
Stocks, bonds, futures, and currency pairs are just a few examples of tradable instruments that are typically subject to forces of supply and demand and can be predicted using technical analysis. In fact, some people think that technical analysis is just the study of supply and demand dynamics as they manifest themselves in changes in a security’s market price.
The most typical application of technical analysis is to price fluctuations, although some analysts also keep track of other metrics like trade volume or open interest levels.
Fundamental Of Technical Analysis
We must presume that previous chart patterns and future stock prices are somehow related in order to use technical analysis to forecast stock prices. Only in this way can we use historical data to accurately forecast future pricing. The technical analysis of equities is predicated on three key tenets.
- Market Prices Reflect All The Information About A Stock
We previously stated that fundamental analysis is concerned with the financial and other details of a stock. Despite being entirely separate from fundamental research, technical analysis of equities operates on a similar principle.
If you are a technical analyst, you can think that all stock market participants are well informed about a stock. When they decide to buy or sell something, they genuinely use this information.
The stock price and, ultimately, the stock chart are updated to reflect this information. They do not consider fundamental variables, instead focusing primarily on chart patterns to determine market trends.
- Patterns Tend To Repeat Themselves
The final supposition supporting a technical analysis is that trends repeat themselves. In other words, imagine that a stock chart follows a hypothetical A-B-C pattern. Therefore, each time we get to “C,” we’ll start over at “A,” then move on to “B,” and finally “C.” Without fail, this trend will continue.
You can use technical analysis to forecast future stock values only after you have made this assumption. Without this presumption, a chart cannot be used to predict where the price will move next.
- Stock Prices Follow Trends
The foundation of technical analysis of stocks is the notion that every stock chart has a distinct trend of its own. Only within this trend do prices change. Every change in the stock price signals the following action. Consider the fictitious ripple as an example.
You can predict that a stone will cause a series of ripples to appear in a pond when you throw it. The trend will fizzle out after a few tremors. However, a similar ripple will reappear the following time you throw a stone.
- Charts
The most often utilised technical indicators for technical analysis are price and volume charts. A volume chart shows how many shares of a company were bought and sold throughout the day.
You can select one of the standard line or bar charts for technical analysis, or you can utilise a candlestick chart instead. A unique type of chart that is particularly useful for technical analysis is the candlestick chart. It takes the shape of a line of subsequent candles. In the section on stock charts, we’ll go into more detail about candlestick charts. Trendlines are used in conjunction with charts.
Trendlines show a stock’s movement over time in one direction or another.
- Moving Averages
In order to eliminate sudden, frequent changes in a stock chart, moving averages are calculated. Stock values can occasionally change dramatically in a short amount of time.
As a result, finding a trend in the stock chart is challenging. A few days’ worth of prices are averaged to reduce the effect of this and highlight a pattern. It is challenging to determine the direction in which prices have truly changed, for instance, if a stock’s price over the last five days has been Rs. 50, 53, 47, 45, and 52. However, you may identify a general trend by calculating the average of these values and comparing it to the average of the following five days and the five days prior.
Importance Of Technical Analysis
- Mathematical Approach
To choose stocks, technical analysts use probability. They can forecast an action’s consequence using probability without necessarily having to examine it in great depth.
Therefore, technical analysis predicts price movements without forcing you to think about the specifics that will drive those movements. In comparison to fundamental analysis, it is considerably quicker and easier.
- Signs Of Upcoming Danger
There are instances when a significant decline in stock prices is imminent but nobody can see it coming. Tools for fundamental analysis cannot foresee it. However, the fall can be predicted using previous chart patterns and other analytical methods.
Technical analysis, of course, cannot explain why a price is falling, but it may predict when one will occur. You can accordingly get ready for it.
For instance, the US stock markets were doing well before the financial crisis of 2009. Nobody could have predicted a swift and significant decline in stock prices.
- Identification Of Short-Term Trends
For investors who wish to make long-term investments, such as three to five years or more, fundamental analysis is increasingly pertinent. This is due to the fact that any lucrative business concept requires time to succeed.
Investors must therefore exercise patience as well. Technical analysis is an exception to this. Ultimately, a company’s profitability determines whether a stock will succeed or fail. Technical analysis cannot be used to anticipate this. It is limited to predicting whether the stock will move up or down in the near term.
Technical Analysis Of Stocks
The main goal of technical analysis is to interpret changes in stock prices and trading activity. However, it is not entirely straightforward to analyse and analyse it. It must be transformed into an understandable format. This data is best presented using stock charts. You can better comprehend stock chart patterns by using the chart patterns listed below.
- Reversal Patterns
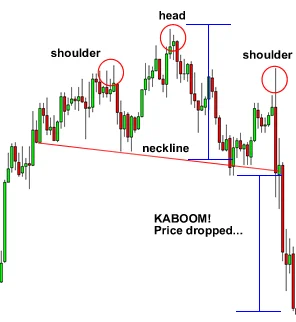
Reversal patterns suggest that the current trend in price movement can change. In other words, if a stock’s price is currently rising, it will begin to fall, and if it is currently falling, it will begin to rise.
Two significant reversal patterns exist:
- Head and shoulders pattern
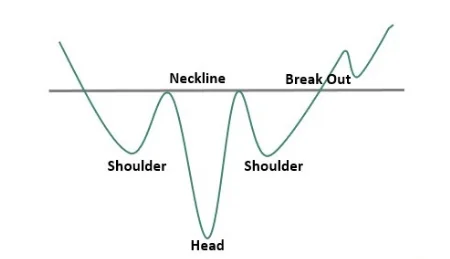
- Inverse Head And Shoulders Pattern
An uptrend is reversed when a head and shoulders pattern appears. But because it is a reversal pattern, it should also signal the conclusion of a downtrend, or a time when prices have been declining steadily. The upside-down formation of the head and shoulders motif indicates such a reversal.
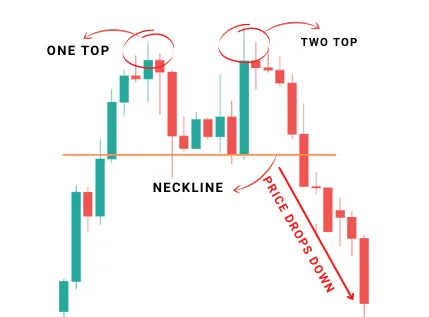
- Double Tops Pattern
There is a double top after a strong upswing. Instead of three waves, it only has two. The cost is the same at both peaks, unlike head and shoulders. The decline when the trend eventually reverses will be greater the longer the period and the fall between the two waves. Similar to the head and shoulders pattern, the formula for determining the target price also applies to double tops.
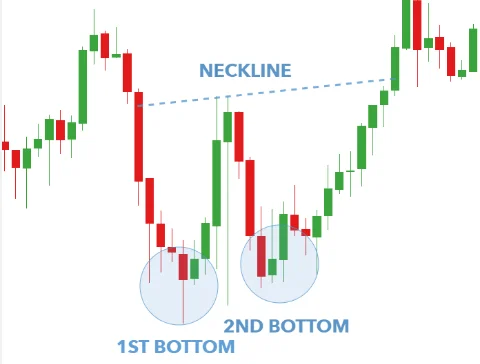
- Double Bottom Pattern
A double bottom pattern, which resembles a water image of the double top pattern, appears after a period of consistently declining prices.
- Contiunation Patterns
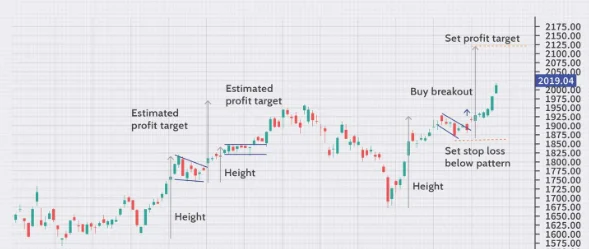
The trend that was depicted by a stock chart before to the development of the pattern would likely continue in the future, according to continuation patterns. For instance, if the price was rising, it would keep doing so. Similar to how it would keep going lower if that was its direction.
- Triangle pattern
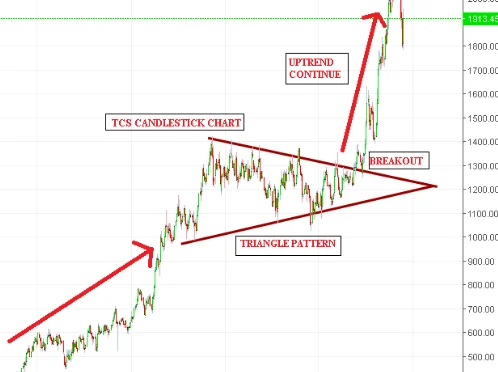
A triangle pattern develops when the distance between the peaks and bottoms on a stock chart keeps getting smaller. As a result, they will converge if trend lines are added for tops and bottoms, respectively. As a result, the design will appear to be a triangle. One of the three causes described below results in a smaller discrepancy between tops and bottoms.
While the peaks remain stable, bottoms are rising.
While the bottoms are stable, the tops are falling
Tops and bottoms are overlapping.
Ascending, descending, and symmetrical triangles are produced by these patterns, respectively.
- Rectangle Pattern
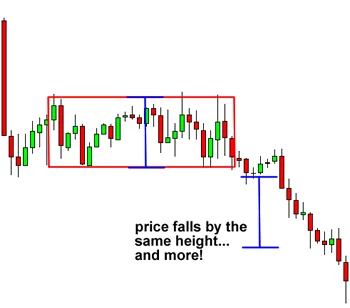
When a stock’s price has been fluctuating within a range, a rectangular pattern develops. Every upward move and every downward move come to an identical top and bottom. In other words, the top and bottom prices remain stable over time.
FOLLOW OUR WEBSITE: https://learningsharks.in/
FOLLOW OUR PAGE: https://www.instagram.com/learningsharks/

1 thought on “What is Technical Analysis in Stock Market?”
Comments are closed.