Introduction
Welcome to our comprehensive Fibonacci retracement guide. In this article, we’ll look at technical analysis and how Fibonacci retracement can be a useful tool for traders and investors. Understanding Fibonacci retracement and its application can provide you with valuable insights into price movements and potential market reversals, whether you’re new to trading or an experienced professional.
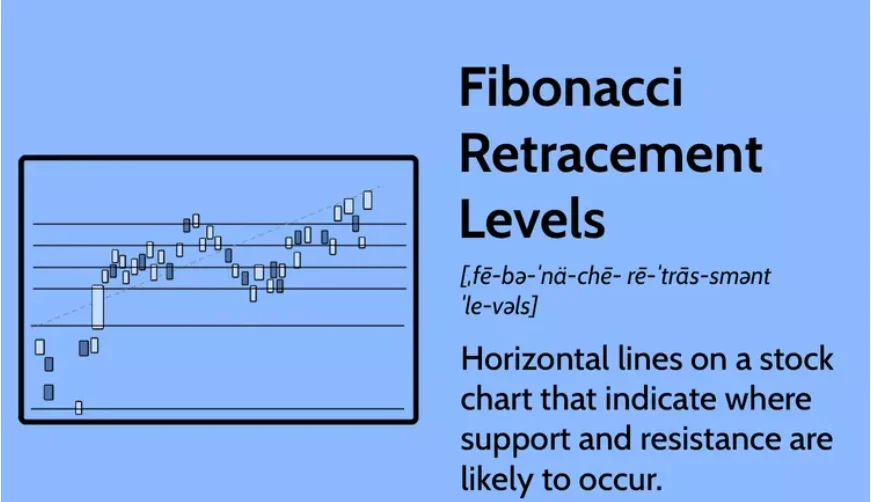
What is Fibonacci Retracement?
Fibonacci retracement is a popular method in technical analysis for identifying potential levels of support and resistance in the price movements of financial instruments. The idea is based on the Fibonacci sequence, which is a series of numbers in which each number is the sum of the two preceding ones (for example, 0, 1, 1, 2, 3, 5, 8, 13, and so on). These numbers have distinct mathematical properties that can be used in financial markets.
How Does Fibonacci Retracement Work?
Fibonacci retracement levels are calculated by drawing horizontal lines across a price chart at key Fibonacci ratios (38.2%, 50%, and 61.8%). These levels indicate possible areas where an asset’s price may experience a temporary pullback or correction before resuming its primary trend. These levels are frequently used by traders to identify entry and exit points, as well as to set stop-loss orders.
The most common Fibonacci retracement levels are as follows:
- 38.2%: This is the shallowest retracement level and is frequently used to identify potential support or resistance near the trend’s continuation.
- 50%: Although this is not a Fibonacci ratio, it is included in Fibonacci retracement analysis due to its significance as a psychological level where buyers or sellers may re-enter the market.
- 61.8%: Also known as the “golden ratio,” this level is considered the most significant Fibonacci retracement level. Traders frequently pay close attention to this level because it is thought to be a strong support or resistance area.
Applying Fibonacci Retracement in Trading
Traders use Fibonacci retracement in a variety of ways to help them make sound trading decisions. Here are some examples of common strategies and techniques:
1. Identifying Potential Entry Points:
By applying Fibonacci retracement to a price chart, traders can identify potential areas where the price is likely to reverse and resume its primary trend. Traders may look for additional confirmation signals, such as candlestick patterns or technical indicators, to increase the probability of a successful trade.
2. Setting Price Targets:
Price targets can also be set using Fibonacci retracement levels. When the price reaches a specific Fibonacci level, traders frequently aim to take profits or close their positions. Instead of relying solely on emotions, this approach allows traders to have predefined exit points based on objective analysis.
3. Confirming Support and Resistance Levels:
Fibonacci retracement levels serve as dynamic levels of support and resistance. When an asset’s price approaches these levels, traders watch the price action for additional confirmation signals to validate potential buying or selling opportunities.
Advantages and Disadvantages of Fibonacci retracement
Advantages
Objective Analysis: Fibonacci retracement provides traders with objective levels that are based on mathematical calculations. This reduces subjective bias and enables more precise analysis of potential support and resistance levels.
Widespread Use: Fibonacci retracement is a commonly used tool in technical analysis. It is well-known among traders and investors, which can lead to increased market awareness and potential alignment of buying and selling decisions.
Historical Significance: The Fibonacci sequence and its ratios have historical significance in a variety of natural and financial phenomena. This historical support strengthens the case for using Fibonacci retracement as a technical analysis tool.
Disadvantage
Subjectivity in Selection: Traders’ starting and ending points for applying Fibonacci retracement may differ, resulting in different retracement levels and potential trading signals. This subjectivity introduces an element of interpretation and can result in inconsistency.
Inaccuracy: While Fibonacci retracement can provide potential levels of support and resistance, it cannot guarantee precise reversal points. To improve the accuracy of their trading decisions, traders should consider using additional technical indicators and confirmation signals.
Market Conditions: Fibonacci retracement works best in trending markets with relatively smooth price movements. The reliability of Fibonacci retracement levels may decrease during periods of high volatility or choppy price action, necessitating additional analysis and caution.
Limitations and Considerations
While the Fibonacci retracement is a powerful tool, it should be used in conjunction with other technical analysis tools and indicators. Consider the following limitations and considerations:
Subjectivity: When using Fibonacci retracement, traders can choose different starting and ending points, resulting in different retracement levels and potential trading signals.
Market Volatility: Fibonacci retracement levels may be less reliable during periods of high market volatility. To confirm potential trading opportunities, it is critical to consider overall market conditions and use additional technical analysis tools.
Not a Standalone Indicator: Fibonacci retracement should be used in conjunction with other technical analysis techniques to validate trading decisions. Using Fibonacci retracement alone may result in inaccurate predictions and false signals.
Conclusion
Finally, Fibonacci retracement is a useful tool in the toolbox of technical analysts and traders. Traders can gain insights into potential price reversals, identify entry and exit points, and set realistic price targets by understanding and applying the concept effectively. However, keep in mind that Fibonacci retracement is only one tool among many, and a comprehensive approach to technical analysis is essential for successful trading.
FOR MORE INFO CLICK THIS SITE:https://learningsharks.in/
FOLLOW OUR PAGE:https://www.instagram.com/learningsharks/?hl=en