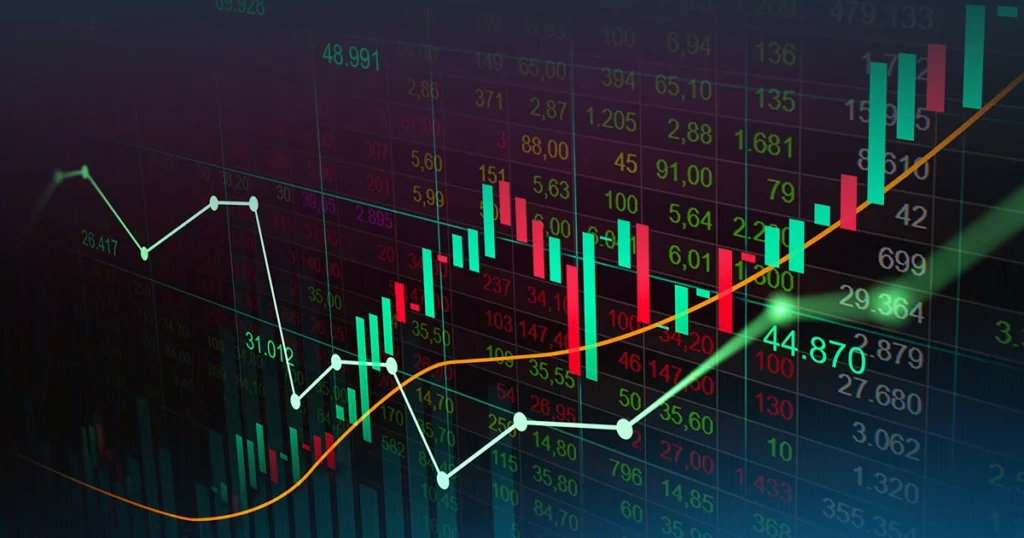
What are Chart Patterns?
Stock chart patterns usually reveal transitions between ascending and descending trends. One can recognise a price pattern, which is a recognisable configuration of price movement, using a series of trendlines and/or curves.
After a brief break, when the trend resumes moving in the same direction, a continuation pattern forms; when the trend reverses direction, a reversal pattern forms.
What is Candlestick Pattern?
A Candlestick chart is a technical tool that combines data from multiple time frames into a single price bar. As a result, they are better than standard open, high, low, close (OHLC) bars or simple lines that connect the closing price dots. Candlesticks produce patterns that can be used to predict price movement once they are complete.
The assumption behind candlestick trading is that each candle reflects a whole day’s worth of news, data, and price movement. This suggests that traders using candles on a swing or longer time frame can reap more rewards.
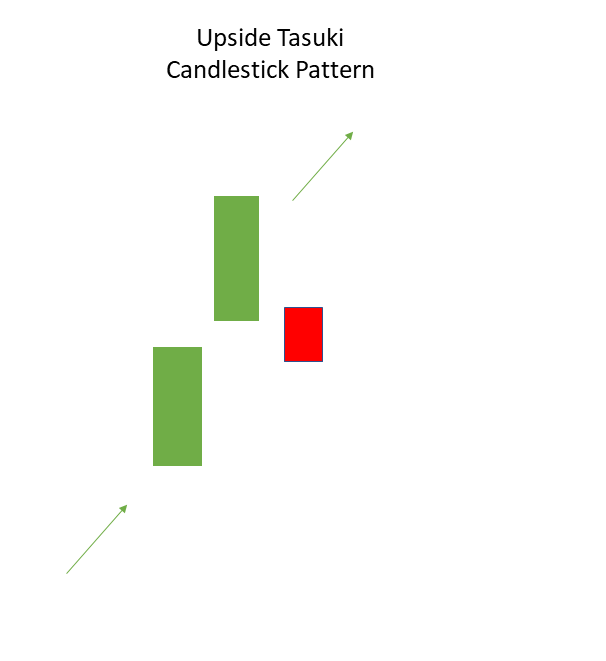
Upside Tasuki Gap
It is a candlestick pattern that formed amid an ongoing rise and is bullish in nature.
This candlestick pattern consists of three candles; the first is a long-bodied bullish candlestick that was formed after a gap up, and the second is a bullish candlestick chart.
The third candlestick is a bearish candle that fills in the void between the first two bullish candlesticks.
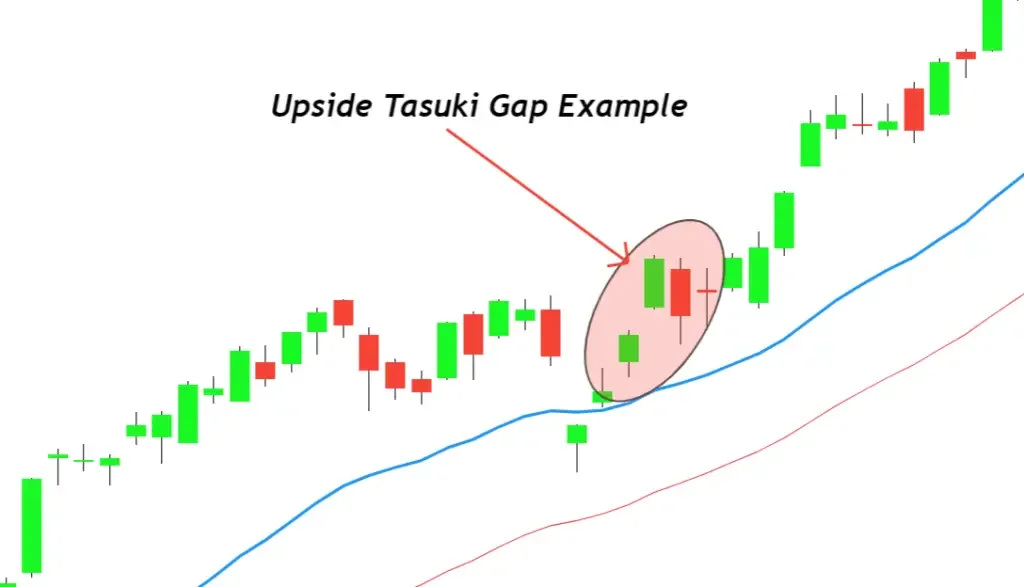
Example:
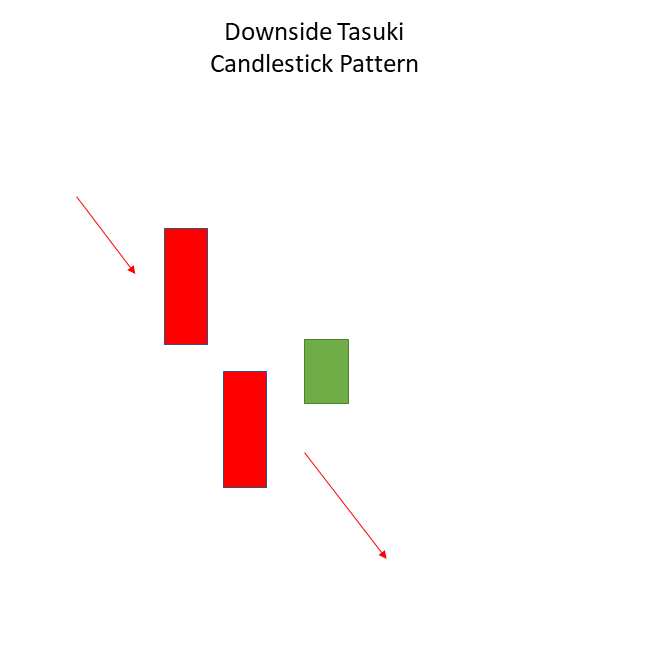
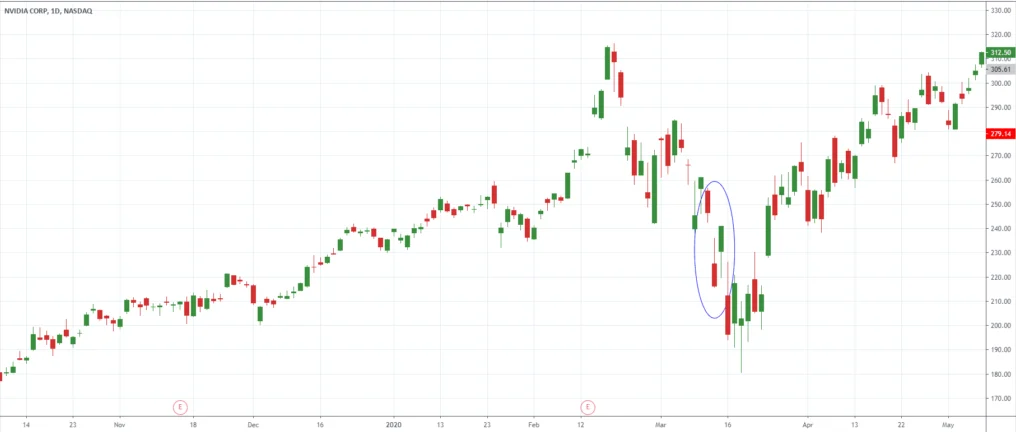
Downside Tasuki Gap
It is a bearish continuation candlestick pattern associated with an ongoing downtrend.
This pattern consists of three candles, the first of which is a long-bodied bearish candlestick made after a gap down. A bearish candlestick also appears on the second candlestick.
The third candlestick is a bullish candle that fills the empty area left by the first two bearish candles.
Example:
Disclaimer: The information above should only be used for educational reasons as it is only an opinion. You can email us if you have any comments or questions regarding this story. Use our contact us page to get in touch.
FOLLOW OUR WEBSITE: https://learningsharks.in/
FOLLOW OUR PAGE: https://www.instagram.com/learningsharks/