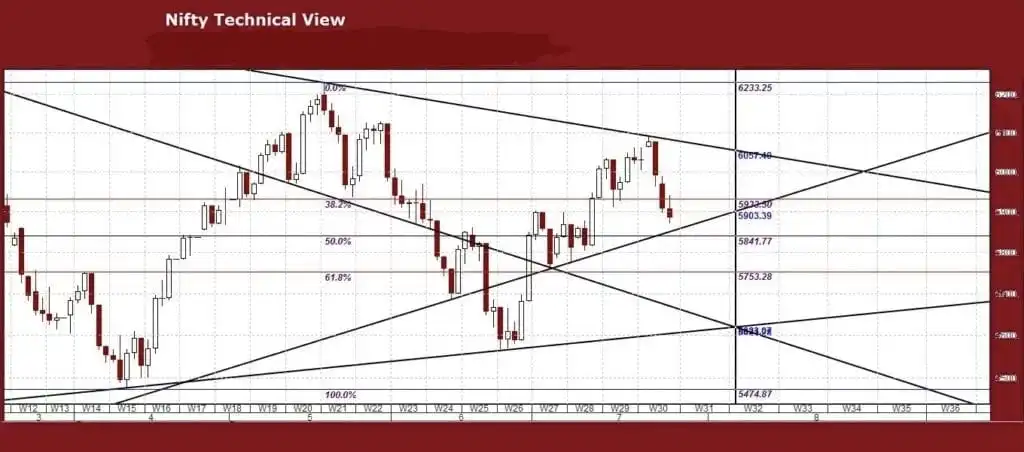
If the Nifty50 maintains firmly above 17,800, it can march towards former swing highs of 17,860 and 17,900-18,000, where some profit taking is possible, while 17,500-17,600 remain critical support levels, according to experts.

The pattern shows a tug of war between bulls and bears for further market direction, as the index has failed to close above the 17,800 level.
The index opened higher at 17,762 and fell to an intraday low of 17,717 before recouping losses near the conclusion of the first hour and trading upward for the remainder of the session. It closed 26 points higher at 17,769, continuing the rise and making higher highs and lower lows for the second consecutive session, which is a good sign.
As a result, if the index maintains firmly above 17,800, the Nifty50 can march towards the earlier swing highs of 17,860 and 17,900-18,000, where some profit taking is possible, although 17,500-17,600 remain critical support levels, according to experts.
If the index falls below 17,720 and retests the level of 17,670-17,625, a slight intraday correction is conceivable,” said Shrikant Chouhan, Head of Equity Research (Retail) at Kotak Securities.
On the other hand, a new uptrend wave is feasible only after the rejection of 17,820, and post-breakout, the odds of the index reaching 17,900-17,925 would improve, he said.
According to option data, the Nifty50 may trade in the 17,500 to 18,000 region in the next sessions.
which might provide immediate support for the Nifty, followed by the 17,600 strike, with Put writing at the 17,800 strike, then the 17,500 strike.
In the later half of the day, it remained consolidative in a narrow range of 150 points between 42,650 and 42,800 levels. Finally, it closed at 42,679, up 43 points, with a tiny body bearish candlestick pattern on the daily charts.
According to Chandan Taparia, Vice President | Analyst-Derivatives at Motilal Oswal Financial Services, it now has to hold above 42,500 levels to rise up to 43,000, then 43,200 levels, while on the downside, supports have gone higher to 42,250, then 42,000 levels.
According to Rahul Ghose, Founder & CEO of Hedged, a breakthrough in Bank Nifty above 43,200 would also confirm an Inverse Head and Shoulder pattern with a first objective of 44,000.
