What is Candlestick Pattern?
A technical technique known as a candlestick chart condenses data from many time frames into a single price bar. They are therefore more beneficial than conventional open, high, low, close (OHLC) bars or straightforward lines that connect closing price dots. Candlesticks create patterns that, when finished, may be used to forecast price movement.
Doji Candle
Dojis are a technical analysis tool for spotting patterns in stock price movement. A trading session is referred to as a “doji” when a security’s open and close are almost equal, much like a candlestick on a chart. The term “doji” has its roots in the Japanese idiom “the same thing”.
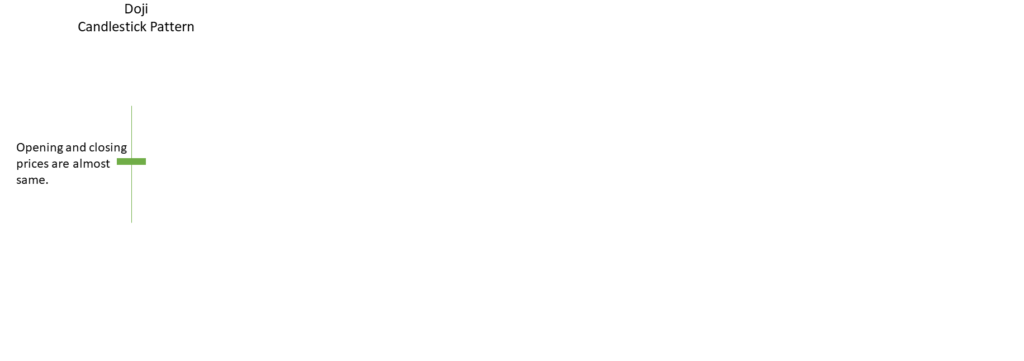
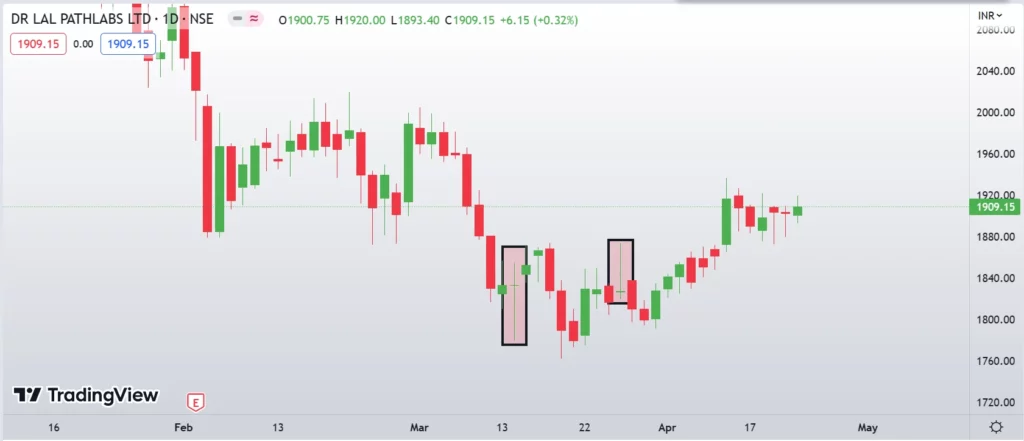
Example:
Spinning Top:
The Doji candlestick pattern, which represents market ambiguity, has the same meaning as the spinning top candlestick pattern.
The only structural difference between a Doji and a spinning top is the size of the real body.
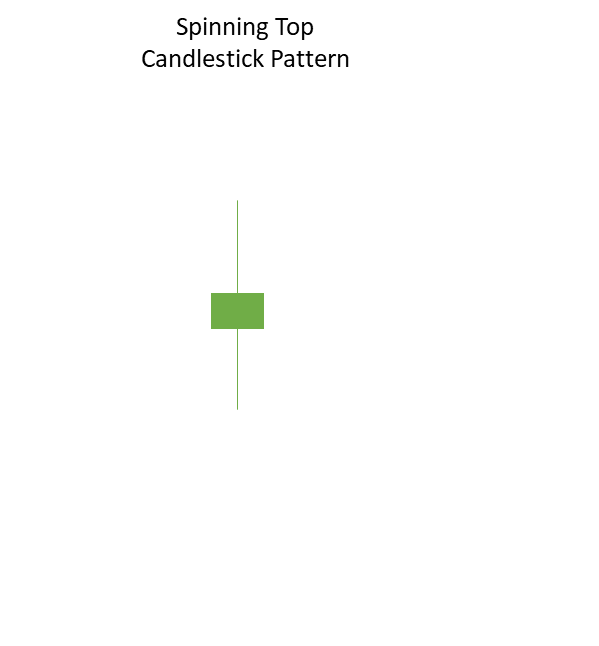
Example:

Disclaimer: The information above should only be used for educational reasons as it is only an opinion. You can email us if you have any comments or questions regarding this story. Use our contact us page to get in touch.
FOLLOW OUR WEBSITE: https://learningsharks.in/
FOLLOW OUR PAGE: https://www.instagram.com/learningsharks/