Learning sharks-Share Market Institute


Rajouri Garden  8595071711 7982037049  Noida 8920210950 , and  Paschim Vihar  7827445731  

Fee revision notice effective 1st Jan 2026; No change for students enrolled before 15th Jan 2026

Download “Key features of Budget 2024-2025here

Investment Related Twitter Feeds That You Should Follow in India!

Market trends and updates have become essential in today’s fast-paced environment. As traders and investors, we should therefore always be aware of the most recent market developments.

Every investor on the market today cannot rely exclusively on their technical expertise. Concerns about the fundamental elements of stock selection must also be kept in mind.

But how can we possibly keep up with all of the news that is available to us when we are so busy making trade decisions and taking positions?

Although televisions might be the solution, it might be challenging for investors to decide which newsfeeds to pay attention to and which ones to ignore.

This is where the constantly interesting Twitter platform comes into play. According to a significant report by a major news outlet, stories occasionally appeared on a reporter’s twitter account before they did so on the official website.

List of Investment Related Twitter Feeds

  1. Livemint
  2. Economic Times
  3. Moneycontrol
  4. NDTV Profit
  5. Safal Niveshak
  6. Basant Maheshwari
  7. Business Standard
  8. Financial Times
  9. ET Markets
  10. Investopedia
  11. CNBC TV 18
  12. India Infoline News
  13. ZeeBusiness
  14. NSE India
  15. Business Today
  16. BloombergTV
  17. WSJ Markets
  18. Groww

1.Livemint

Having roughly 2million followers, @livemint provides information on breaking news and analysis on Indian and world businesses, economy, geo-politics from Mint newspaper.

We can find tweets roughly every five to ten minutes on the most important news floating in the markets.

2.Economic Times

India’s No. 1 Business Daily, EconomicTimes, is a Times Internet Product and provides us with the most recent news feed.

It has about 4.3million followers ,@ EconomicTimes making it one of the most popular Twitter accounts for financial and market feeds.

3.Moneycontrol

Only breaking news, in-depth company and market analyses, and other investment tools are covered by @moneycontrolcom.

This account keeps us on our toes at all times. It has 1.4M followers.

4.NDTV Profit

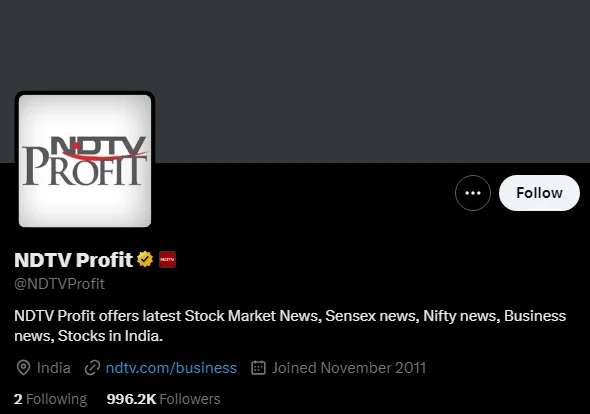
NDTV Profit is streamed live via tweets from @NDTVProfit. This provides the most recent news about the stock markets, the Sensex, the Nifty, and other business news. It has about

996.2K followers.

5.Safal Niveshak

For individual investors, financial and market news is crucial when making financial decisions. The founder of Safalniveshak, Mr. Vishal Khandelwal, aims to empower small investors by educating them on how to make informed financial decisions.

On Twitter, we can follow him at @safalniveshak. There are currently 190.1kfollowers

6.Basant Maheshwari

Through his platform @BMEquityDesk, Mr. Basant Maheshwari shares important information such as newsletter excerpts and his personal market thoughts together with the most recent financial news.

270.6k followers

He is a co-founder and partner at Maheshwari Wealth Advisers LLP (A SEBI registered Portfolio Manager), and the author of the book “The Thoughtful Investor.”

7.Business Standard

This feed offers live coverage of stories including the economy, businesses, markets, politics, and technology. One of India’s top newspapers goes by the initials BS, which stand for Business Standard.

@bsindia has about 2.2 million followers.
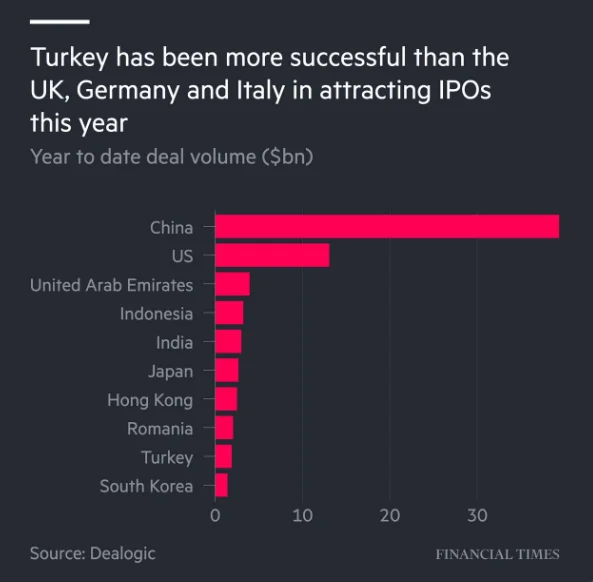
8.Financial Times

One of the first financial media outlets to go into print was Financial Times.

The Twitter handle for the most recent business periodicals is @FinancialTimes.

In this handle, we may access the most recent information and viewpoints regarding corporate events. With 7.5million followers the account has one of the most active Twitter followings.

9.ET Markets

As investors, we may anticipate being fully informed about the markets via @ETMarkets, one of the most promising sources for news and opinions on the financial markets.

There are about 627.6k followers of the handle.

10.Investopedia

Using @Investopedia, which offers free educational films and learning resources to new aspirants in the markets, is the best way to learn about the financial jargons if we are a newbie in the world of financial markets. Approximately 172.1k followers

11.CNBC TV 18

Having around 1.2M followers, @CNBCTV18Live is the twitter news ticker for CNBC-TV18. It helps investors in staying ahead of the markets via latest news in business and financial world.

12.India Infoline News

Investors should make great use of @IIFL_Live since it is a one-stop shop for all the most recent market developments and news pertaining to the Indian economy.

As investors, we can anticipate receiving updates on the breaking news quite frequently. The account currently has 39.4k followers.

13.ZeeBusiness

Zee Business is the first 24-hour Hindi business channel in India and is regarded as a vehicle for wealth and profit.

The Zee Business twitter account, @ZeeBusiness, features a variety of TV news and special programs to inform investors about market developments and how to make money. There are

670.1k followers of the handle.

14.NSE India

In the official twitter account of India’s top stock exchange, NSE, we may get information about the economy, markets, sectors, companies, bonds, equities, government securities, investment strategy, and changes in rules and regulations.

There are 685k followers on the account, @NSEIndia

15.Business Today

Business Today is the top business publication, and @BT_India is the publication’s official twitter handle. This account tweets about the most recent developments in business (which includes all news and events pertaining to corporations and governments).

Approximately 1.1M follower the account.

16.BloombergTV

By providing the most recent feeds on events happening around the world, @BloombergTV enables investors all over the world to stay ahead of the markets.

Along with news, we may anticipate the most recent interviews, viewpoints, panel discussions, and forum gatherings for the same. Approximately 770.5K follower the account.

17.WSJ Markets

The Wall Street Journal’s official twitter account is @WSJMarkets. Breaking news, in-depth analysis, and opinions on international markets and finance are all presented on the account. As a result, this account becomes crucial for investors everywhere.

Approxmately 865.4K Follower the account

18.Groww 

An investment tool called Groww keeps you informed of market developments via its twitter account.

Groww is your go-to source on Twitter for information on all things financial, including stocks, mutual funds, insurance, and personal finances.

@_groww and 102.2K follower

FOR MORE INFO CLICK THIS SITE:https://learningsharks.in/

FOLLOW OUR PAGE:https://www.instagram.com/learningsharks/?hl=en

How to Research Stocks ?

What is Stock Research?

Stock research is a technique for evaluating equities based on aspects including the company’s finances, management, and competitors. Stock analysis aids investors in assessing a stock and determining whether it merits inclusion in their portfolio.

4 steps to research stocks

Before we get started, it’s important to keep in mind that stocks are long-term investments because they are quite risky; you need time to ride out any ups and downs and reap the rewards of long-term gains. For money you won’t need for at least the next five years, investing in equities is the greatest option.

1. Gather your stock research materials

Start by going over the business’s finances. Gathering the following documents, which businesses must submit to the U.S. Securities and Exchange Commission (SEC), is the first step in quantitative research.

  • An annual report that includes significant financial statements that have undergone an independent audit is known as a Form 10-K. You can look at a company’s balance sheet, income sources, cash management practices, revenues, and expenses here.
  • Form 10-Q: A quarterly report on business and financial performance.

2. Narrow your focus

There are many figures in these financial reports, making it simple to become overwhelmed. Focus on the following line items to learn about a company’s measurable internal operations:

Revenue:This is the total revenue a business generated throughout the time period. Because it appears first on the revenue statement, it is frequently referred to as the “top line.” Revenue can occasionally be divided into “operating revenue” and “nonoperating revenue.” The company’s operating revenue, which comes from its main line of activity, is the most revealing. Non-operating revenue is frequently generated by one-time company operations, such selling an asset.

Net income:The amount a firm makes overall after operating costs, taxes, and depreciation are removed from revenue is known as the “bottom line” amount since it is presented at the end of the income statement. Revenue is the same as your gross pay, and net income is the amount that is left over after covering your living expenditures and taxes.

Earnings and earnings per share (EPS):Earnings per share is calculated by dividing earnings by the total number of shares that are available for trading. This figure illustrates a company’s profitability on a per-share basis, making comparisons with other businesses simpler. If you see “(ttm)” after earnings per share, that stands for “trailing twelve months.”

Earnings are far from being an ideal financial metric because they do not reveal how effectively or how the company uses its cash. Some businesses use those profits to boost their operations. Others distribute them as dividends to shareholders.

Price-earnings ratio (P/E):The trailing P/E ratio of a corporation is calculated by dividing its current stock price by its earnings per share, which are typically over the last 12 months. The future P/E is calculated by dividing the company price by the expected earnings predicted by Wall Street analysts. This indicator of a stock’s value reveals how much investors are ready to spend to receive $1 in current earnings from the company.

Remember that the P/E ratio is derived from the potentially inaccurate calculation of earnings per share, and that analyst predictions are notoriously short-term oriented. As a result, it is not a valid stand-alone metric.

Return on equity (ROE) and return on assets (ROA):

Return on equity quantifies, in percentage terms, how much profit a business makes off each dollar invested by shareholders. Shareholder equity makes up the equity. Return on assets demonstrates how much profit a corporation makes for every dollar invested in assets. Each is calculated by dividing the annual net income of a corporation by one of those variables. These percentages also provide information about how effectively the business generates profits.

Again, watch out for gotchas. By repurchasing shares to lower the shareholder equity denominator, a business can raise return on equity artificially. The number of assets used to compute return on assets grows as more debt is taken on, such as loans to finance property purchases or to increase inventory.

3. Turn to qualitative stock research

Qualitative stock research offers the technicolor details that give you a more accurate image of a company’s operations and future, whereas quantitative stock research discloses the black-and-white financials of a company’s tale.

The famous quote from Warren Buffett goes, “Buy into a company because you want to own it, not because you want the stock to go up.” This is due to the fact that when you buy stocks, you buy a personal investment in a company.

You can use the following queries to assist you weed out possible business partners:

How does the business generate revenue? When it comes to a retailer whose primary activity is selling clothing, it can be quite clear. Sometimes it’s not, as in the case of a fast-food chain that makes the majority of its money through franchising deals or an electronics company that depends on consumer financing for expansion. Investing in firms that make sense and that you actually understand is a sound strategy that has worked well for Buffett.

Is there a competitive edge for this business? Look for a quality in the company that makes it challenging to duplicate, match, or surpass. This could be, among other things, its reputation, commercial strategy, capacity for innovation, research prowess, ownership of patents, operational competence, or superior distribution capacities. The strength of the competitive advantage increases with the difficulty of competitors breaching the company’s moat.

How effective is the management group? The ability of a company’s leaders to set direction and guide the business determines how successful it will be. Reading the transcripts of business conference calls and annual reports can reveal a lot about management. Do some study on the board of directors of the business, who sit in the boardroom as the shareholders’ representatives. Be aware of boards that are primarily made up of business insiders. You want to see a good mix of independent thinkers who can evaluate management’s activities with objectivity.

What might possibly fail? We’re not discussing events that can have a short-term impact on the stock price of the company, but rather fundamental shifts that have a long-term impact on a company’s capacity for expansion. Use hypothetical “what if” situations to spot potential red flags: A significant patent expires, the CEO’s replacement steers the company in a different path, a strong rival enters the market, or new technology displaces the company’s goods or services.

4. Put your stock research into context

As you can see, there are several measurements and ratios that investors may use to determine a company’s intrinsic worth and evaluate its overall financial health. However, focusing only on a company’s earnings from a single year or the most recent actions made by the management team would only provide you a partial view.

Build an informed narrative about the company and what characteristics make it deserving of a long-term relationship before you purchase any stock. Context is essential for doing it.

Pull back the scope of your investigation and examine previous data to gain a long-term perspective. You can learn more about the company’s ability to overcome obstacles, adapt to changing circumstances, and enhance performance over time by doing this.

Then, by comparing the figures and key ratios to industry averages and other businesses in the same or similar industries, consider how the company fits into the overall picture. On their websites, several brokers provide research resources. Using the educational resources provided by your broker, such as a stock screener, is the simplest way to make these comparisons.

Conclusion

A company’s performance can be compared to that of its competitors in its industry as well as to itself over the course of several years by gathering the right information from the right websites, looking at some key numbers, and asking some crucial questions.

FOR MORE INFO CLICK THIS SITE:https://learningsharks.in/

FOLLOW OUR PAGE:https://www.instagram.com/learningsharks/?hl=en

FacebookTwitterEmailWhatsAppTelegramShare

8 Best Indian Stock Market Blogs to Follow in 2023

Investing education’s top Indian stock market blogs to follow: You’ve come to the correct place if you’re seeking for the top Indian stock market blogs to follow.

Despite the fact that there are hundreds of blogs in India dedicated to stock investment, we have hand-selected the top 8 for every equities investor in India.

8 Best Indian stock market Blogs to Follow

1. Trade Brains

Kritesh Abhishek, a graduate of NIT Warangal, established Trade Brains in January 2017. Within a year and a half of its launch, it had over 42,500+ newsletter subscribers, making it the fastest-growing financial educational blog in India. The Trade Brains site is dedicated to educating DIY (do-it-yourself) investors about stock market investing and personal finance.

You can also learn about stock market investing in Trade Brains’ recently launched Android mobile app. Here’s the link to download the app on the play store.

2. Get Money Rich (GMR)

Mani, who started the site Get Money Rich (GMR) in 2008, is the owner. This blog features a variety of informative articles on topics like real estate, income tax, personal finance, mutual funds, and stock investment.

If you’re a novice investor (or even an experienced one), you may read these articles to learn how to analyse companies, what elements to take into account, and how to determine whether a stock is inexpensive or overvalued. This site continuously analyses new stocks.Here’s a list of a few recent stock analyses by getting a money-rich blog.

It’s one of the top Indian stock market blogs for learning how to invest in stocks and enhancing your additional financial knowledge because of its straightforward and simple-to-understand information.

3. Fundoo Professor

Sanjay Bakshi is the manager of Fundoo Professor. Two well-liked MBA courses he teaches are “Behavioural Finance & Business Valuation” and “Financial Shenanigans & Governance” to MDI Gurgaon students. Mr. Bakshi posts his opinions as a teacher and practitioner of value investing and behavioural economics on the fundoo professor blog.

Hundreds of fantastic free lectures on investment and human behaviour may be found on this blog. Indian investors should read it to create a solid investing basis.

4. Safal Niveshak

A successful investor is referred to as “Safal Niveshak.” Anshul Khare and Vishal Khandelwal are in charge of running this blog. Vishal has been an investor for more than 15 years. The goal of the Safal Niveshak blog is to assist novice stock market investors in making wise, responsible, and profitable selections. They have more than 47,000 subscribers to their newsletter.

This site is one of the top Indian stock market blogs because it contains many useful investing lessons.

5. Nitin Bhatia

Nitin Bhatia, who oversees this site, writes about topics such as investments, insurance, stocks, mutual funds, credit scores, taxes, and business start-ups. In addition, they manage a YouTube channel with more than 290,000 subscribers.

6. Stable Investor

Dev Ashish, an investment advisor registered with SEBI, is the owner of Stable Investor.

This blog is dedicated to assisting readers in making wise financial decisions, organising their personal finances, and making profitable stock investments. There are approximately 11,000 subscribers to Stable Investor’s newsletter.
Additionally, Stable Investor offers a range of financial services, such as financial planning, retirement planning, planning for the future of one’s children, etc.

7. Dr. Vijay Malik

Dr. Vijay Malik, a SEBI certified analyst, is the owner of this site. Since 2006, he has participated extensively in the Indian equity markets. His blog posts aim to make the process of choosing investments more understandable. Premium services are offered on Dr. Vijay Malik’s site, including a class on “Peaceful Investing,” an Excel sheet for stock research, ebooks, etc.

This blog is worth mentioning in our list of the finest Indian stock market blogs since you can read the analysis reports of numerous stocks that are published on it for free.

8. Moneyexcel Personal Finance

Founder of the blog is Shitanshu Kapadia. The Moneyexcel blog educated readers on money matters and financial services. This site features almost 1800 posts and focuses on a wide range of subjects, including the stock market, mutual funds, income tax, credit cards, company ideas, and career advice. Their YouTube channel has more than 12400 subscribers.

FOR MORE INFO CLICK THIS SITE:https://learningsharks.in/

FOLLOW OUR PAGE:https://www.instagram.com/learningsharks/?hl=en

Understanding Liquidity and How to Measure It ?

What Is Liquidity?

When a financial asset or security may be quickly and easily converted into cash without depreciating in value, this is referred to as having liquidity. Cash alone is the most liquid of all the assets.

An asset may be converted back into cash more quickly and efficiently the more liquid it is. Less liquid assets require more time and could cost more.

Understanding Liquidity

In other words, the degree to which an asset may be swiftly purchased or sold on the market at a price representing its underlying value is referred to as liquidity. Due to its ease and speed of conversion into other assets, cash is regarded as the most liquid asset. Real estate, fine art, and collectibles are examples of tangible goods that are all rather illiquid. Other financial assets fall at various points throughout the liquidity spectrum, from stocks to partnership units.

Cash, for instance, is the resource that can be utilized to buy a $1,000 refrigerator most readily. The likelihood of finding someone willing to exchange them the refrigerator for their collection is slim if they have no cash but a rare book collection worth $1,000. They will have to sell the collection instead, then use the proceeds to pay for the refrigerator.

If the person has months or years to wait before making the purchase, it might be okay, but if the person only had a few days, it might be problematic.Instead of waiting for a buyer who was prepared to pay the full amount, they might have to sell the books at a discount. An illustration of an illiquid asset is rare books.

Market Liquidity

Market liquidity describes how easily assets may be purchased and sold in a market, such as the stock exchange of a nation or the real estate market of a city, at predictable, open prices. In the aforementioned case, the market for refrigerators in exchange for rare books is so unviable that it essentially does not exist.

On the other side, the stock market has a larger level of market liquidity. The price that a buyer offers per share (the bid price) and the price that a seller is ready to take (the ask price) will be very close to one another if an exchange has a significant volume of activity that is not dominated by selling.

Therefore, investors won’t have to forfeit unrealized gains in exchange for a speedy sale. The market is more liquid when the difference between the bid and ask prices narrows; as it widens, the market becomes less liquid. Real estate markets typically have much lower levels of liquidity than stock markets. The size and number of open exchanges on which markets for other assets, such as futures, contracts, currencies, or commodities, can be exchanged frequently affects how liquid those markets are.

Accounting Liquidity

Accounting liquidity evaluates a person’s or a business’s ability to easily satisfy their financial commitments with the liquid assets at their disposal—their capacity to settle debts when they become due.

The rare book collector in the case above has somewhat illiquid assets, so they probably wouldn’t be worth their full $1,000 value in an emergency. Assessing accounting liquidity in terms of investments entails contrasting liquid assets with current liabilities, or debts that are due within a year.

Accounting liquidity is measured by a number of ratios, each of which has a different definition of what constitutes liquid assets. These are used by analysts and investors to find organizations with high liquidity. It is also regarded as a depth measurement.

Measuring Liquidity

Financial analysts assess a company’s capacity to meet short-term obligations with liquid assets. In general, a ratio greater than one is preferred when applying these calculations.

Current Ratio

The easiest and most flexible is the current ratio. It compares current obligations to current assets (those that may theoretically be converted to cash in one year). Its equation would be:

Current Ratio = Current Assets ÷ Current Liabilities

Quick Ratio (Acid-Test Ratio)

The fast ratio, often known as the acid-test ratio, is a little stricter. It does not include inventory or other current assets, which are less liquid than short-term investments, cash and cash equivalents, and accounts receivable.

The formula is:

Quick Ratio = (Cash and Cash Equivalents + Short-Term Investments + Accounts Receivable) ÷ Current Liabilities

Acid-Test Ratio (Variation)

The quick/acid-test ratio can be made a little more forgiving by just deducting inventory from current assets:

Acid-Test Ratio (Variation) = (Current Assets – Inventories – Prepaid Costs) ÷ Current Liabilities

Cash Ratio

Of all the liquidity measurements, the cash ratio requires the highest precision. It defines liquid assets strictly as cash or cash equivalents, excluding accounts receivable, inventory, and other current assets.

The cash ratio evaluates an entity’s potential to remain solvent in the worst-case scenario more accurately than the current ratio or acid-test ratio since even highly lucrative businesses might have financial difficulties if they lack the liquidity to respond to unforeseen circumstances. It is as follows:

Cash Ratio = Cash and Cash Equivalents ÷ Current Liabilities

Liquidity Example

Equities are one of the most liquid asset classes when it comes to investments. But in terms of liquidity, not all stocks are created equal. On stock exchanges, some shares are traded more frequently than others, indicating a larger market. In other words, traders and investors show a higher and more persistent interest in them.

The daily volume of these liquid equities, which can range from millions to hundreds of millions of shares, is typically what allows investors to identify them. It is simpler for investors to purchase or sell a stock when it has a high volume since there are many buyers and sellers in the market, which reduces the impact of price fluctuations.

Low-volume equities, on the other hand, could be more difficult to purchase or sell because there might be fewer market players and consequently less liquidity.

For instance, 69.6 million shares of Amazon.com Inc. (AMZN) traded on exchanges on March 13, 2023. Only 48.1 million shares of Intel Corp. (INTC) were traded in comparison, indicating that it was a slightly less liquid stock. However, Ford Motor Company (F) was the most active and perhaps the most liquid of these three companies on that day with a volume of 118.5 million shares.

Why is liquidity important?

It is challenging to sell or convert assets or securities into cash when markets are not liquid. For instance, you might possess a priceless family heirloom that has a $150,000 appraisal. If there isn’t a market for your item, though (i.e., no buyers), it is useless because nobody will pay anything close to its appraised value—it is extremely illiquid. It might even be necessary to hire an auction house to serve as a broker and find potential buyers, which will take time and cost money.

However, liquid assets can be swiftly and readily sold for their full value at little to no expense.Companies must also maintain a sufficient level of liquid assets to fulfill their immediate liabilities, such as bills and payroll, or else they risk experiencing a liquidity crisis that could force them into bankruptcy.

What are the most liquid assets or securities?

Cash and its equivalents, such as money market accounts, certificates of deposit (CDs), and time deposits, are the most liquid assets. Marketable securities, such the stocks and bonds listed on exchanges, are frequently quite liquid and can be swiftly sold via a broker. Additionally, it is simple to sell gold coins and some valuables for cash.

What are some illiquid assets or securities?

Securities that are traded over the counter (OTC), such as certain complex derivatives, are often quite illiquid. For individuals, a home, a time-share, or a car are all somewhat illiquid in that it may take several weeks to months to find a buyer, and several more weeks to finalize the transaction and receive payment. Moreover, broker fees tend to be quite large (e.g., 5% to 7% on average for a real estate agent).

Why are some stocks more liquid than others?

The equities with the highest daily transaction volume and greatest level of interest from diverse market participants tend to be the most liquid. These equities will also draw more market makers, who keep a more tightly controlled two-sided market.

Stocks that are less liquid have shallower markets and broader bid-ask spreads. These brands frequently have lower market value and volatility, a lower trading volume, and a lower degree of brand recognition. Therefore, a large multinational bank’s stock will typically be more liquid than a small regional bank’s.

FOR MORE INFO CLICK THIS SITE:https://learningsharks.in/

FOLLOW OUR PAGE:https://www.instagram.com/learningsharks/?hl=en

FacebookTwitterEmailWhatsAppTelegramShare

What is Nifty 50?

The Nifty 50 is an Indian stock market index that is frequently referred to as just “Nifty.” The 50 biggest and most liquid firms listed on the National Stock Exchange of India (NSE) are represented by their performance. One of the most popular equity indices in India and a benchmark for the local stock market is the Nifty 50.

It represents the performance of the 50 largest and most liquid Indian companies from various sectors. Here's a general guide on how to trade in the Nifty:
nifty

Following are some crucial details about the Nifty 50:

  • The Nifty 50 index is made up of businesses from a range of Indian economic sectors, including banking, information technology, manufacturing, and consumer products. According to the market capitalization and liquidity of the companies, the composition is reviewed on a regular basis and subject to change.
  • Market Capitalization: The component firms’ market capitalizations are used to weight the index. This indicates that the movements of the index are more significantly influenced by larger companies.
  • Performance Benchmark: For mutual funds, exchange-traded funds (ETFs), and individual investors, the Nifty 50 acts as a performance benchmark. In India, a large number of investment products are made to mimic or follow the performance of the Nifty 50.
  • The index strives to offer a diversified representation of the Indian stock market in terms of sector representation. It contains businesses from a range of industries, lowering the risk of concentration.
  • Calculation: A free-float market capitalization-weighted formula is used to determine the Nifty 50. This means that the computation takes into account just the shares that are freely tradable on the market (also known as the “free-float”).
  • Importance: Because it sheds light on the general direction of the Indian equities market, the Nifty 50 is extensively watched by investors, traders, and financial analysts. Market sentiment and trends are evaluated using changes in the index’s value.
  • Investment Strategy: A lot of investors’ investment strategies include Nifty 50-based goods. For instance, they might put money into index funds or exchange-traded funds (ETFs) that follow the Nifty 50 to get exposure to a variety of large-cap Indian stocks.
  • Volatility: The Nifty 50 may occasionally face periods of volatility and fluctuations in response to local, national, and international events, just like any stock market index.

How they work in Stock Market?

The entire performance of a set of equities is measured or benchmarked by stock market indices like the Nifty 50. They give investors and other market participants a means to monitor and evaluate the state of the stock market and its movements. Here is how the stock market operates:

  • Stock market indexes are made up of a particular group of stocks, which are chosen as constituent stocks. Depending on the index, different predetermined criteria may be used to choose these equities. For instance, depending on variables like market capitalization and trading volume, the Nifty 50 chooses the 50 biggest and most liquid stocks listed on the National Stock Exchange of India (NSE).
  • Weighting Methodology: The index assigns a weight to each component stock based on a certain methodology. Market capitalization weighing, equal weighting, and price weighting are typical techniques. Larger companies have a greater impact on the performance of the index because to market capitalization weighting, which is utilised in the Nifty 50.
  • Calculation: The index value is determined by adding the stock prices of each individual component while accounting for the weights assigned to each. The precise weighting approach used determines the formula used to get the index value. In a market capitalization-weighted index, for instance, the total market capitalization of all the component stocks determines the index value.
  • Regular Updates: Periodically, stock market indices are usually examined and updated. This evaluation may result in adjustments to the constituent stocks, updates to the weighting formula, or other changes. These revisions guarantee that the index continues to reflect the state of the market.
  • Tracking Performance: Investors and other market players use these indices to assess the performance of a particular stock market sector. To gauge how well they are performing in comparison to the larger market, individuals might compare the performance of their personal investments or portfolios to that of the index.
  • Investment Products: A variety of financial products, including exchange-traded funds (ETFs) and index funds, are made to mimic the performance of a certain index. Without buying individual stocks, investors can purchase shares in these products to acquire exposure to the entire index or a particular market segment.
  • Benchmarking: Indices are also used as benchmarks to compare the performance of mutual funds, professional portfolio managers’ portfolios, and other investment techniques. Successful funds are frequently those that continuously outperform their benchmark indices.
  • Market Sentiment: Changes in an index’s value can be a good indicator of how the market is feeling and how the economy is doing. A rising index may represent optimism, whilst a falling index can represent worries or a pessimistic view.
  • Market Research: To perform market research and spot patterns, analysts and researchers frequently use historical data from indices. They might do a performance analysis in order to forecast future market trends.

Advantages and Disadvantages of Nifty 50?

Advantages

  • Benchmarking: Indices offer a standard by which to compare the performance of certain equities, mutual funds, and portfolios. Investors can evaluate the relative success of their investments thanks to this.
  • Investments in indexes or index funds provide immediate diversification across a portfolio of stocks. This spreads out risk and lessens exposure to a single stock’s potential underperformance.
  • Investment simplicity: Without purchasing individual equities, investors can acquire exposure to a large market or a particular sector. This makes investing easier, especially for those who do not have the time or knowledge to choose specific assets.
  • Low Costs: Compared to actively managed funds, index funds and ETFs that follow indices frequently have lower cost ratios. Over time, this may lead to decreased expenses for investors.
  • Transparency: Because indices are created using pre-established guidelines and standards, it is clear how they were put together. Investors can comprehend the index’s meaning and methodology thanks to this openness.
  • Index-based goods are typically quite liquid, which means that buying or selling them on the market is simple and has little impact on their prices.
  • Historical Information: Indices offer a plethora of historical information that can be used for analysis, research, and decision-making.

DisAdvantages

  • Lack of Selectivity: The companies that make up indices are made up of both strong and poor companies. Investors in index funds are exposed to all of the index’s companies, even the ones that are performing poorly.
  • Indices are sometimes prone to market volatility, particularly during recessions or market meltdowns. The value of investments based on indexes may suffer as a result.
  • Due to tracking error, index funds and ETFs may not accurately reflect the performance of the index. Returns that differ from the index’s returns might be brought on by elements including fees, trading expenses, and poor portfolio management.
  • Absence of Active Management Index-based solutions don’t entail actively choosing stocks or timing the market. As a result, they are unable to control risks or seize opportunities the way active fund managers can.
  • Popular indices may occasionally become overpriced as buyers rush to purchase index-based goods, driving up the stock prices of the index’s constituents.
  • Sector Concentration: Some indexes may be heavily concentrated in a few particular sectors or industries, exposing investors to risks unique to those sectors.
  • Criteria for Inclusion and Exclusion: When firms are added to or removed from an index, it may cause sudden purchasing or selling of stocks. Stock prices may be impacted by this.
  • Investors in index-based products have little control over how their portfolios are put together, which may not be in line with their particular investment objectives or tastes.

Conclusion

As a result of serving as benchmarks for evaluating market performance and giving investors options for diversification and simpler investing, stock market indexes like the Nifty 50 are significant in the world of investing. They are useful tools for a number of tasks, such as benchmarking, following market trends, and creating diversified portfolios.

These indices do, however, also have a unique set of benefits and drawbacks. The benefits include simplicity in investing, diversification, reduced costs, openness, and historical data. Conversely, there are drawbacks such a lack of selectivity, susceptibility to market volatility, a possible tracking inaccuracy, and little influence over how one’s portfolio is put together.

Ultimately, the choice between investing in stock market indices or individual stocks depends on an investor’s specific goals, risk tolerance, and preferences. Some investors prefer the simplicity and diversification offered by index-based products, while others may opt for individual stock selection to potentially outperform the broader market. It’s important for investors to carefully consider these factors and conduct thorough research before making investment decisions. Additionally, seeking guidance from financial professionals can be beneficial when navigating the complexities of the stock market.

FOR MORE INFO CLICK THIS SITE:https://learningsharks.in/

FOLLOW OUR PAGE:https://www.instagram.com/learningsharks/?hl=en

IRDAI requests SEBI investigate the Axis Bank-Max Life agreement.

The insurance regulator requests SEBI look into whether the book was used to assess the fair market value. CNBC-TV18 reported this.

After looking into the transfer of Max Life’s shares to Axis businesses in March 2021, the IRDAI penalized Max Life Rs 3 crore on October 13, 2022.

According to CNBC-TV18 on August 31, the Insurance Regulatory and Development Authority of India (IRDAI) has written to the Securities and Exchange Board of India (SEBI) requesting that it look into the Axis Bank-Max Life Insurance agreement. A division of Max Financial Services is Max Life Insurance.

To determine whether there were any irregularities in estimating the fair market value of Max Life Insurance shares, the insurance regulator has ordered SEBI to conduct an investigation.

Only IRDAI had previously been looking into share transfers made in March 2021 and had also levied a fine, but now the regulator has also enlisted SEBI, according to CNBC-TV18.

In an August 9 filing, Axis Bank stated that its board had approved increasing the bank’s share in the life insurance from 9.9 percent to 16.22 percent, bringing the total stake held by Axis businesses to 19.02 percent.

In order to purchase 14.25 crore shares at Rs 113.06 each, the bank will inject Rs 1,612 crore into Max Life, representing a premium of Rs 103.06 per share over the face value of Rs 10 per share, it was announced.

According to the filing, the transaction was made to improve the bank’s position in the life insurance industry.

IRDAI repression

Following an investigation on the transfer of shares to Axis businesses in March 2021, the IRDAI fined Max Life Rs 3 crore on October 13, 2022.

According to its findings, Axis Bank sold shares to Max Financial Service Limited (MFSL) and Mitsui Sumitomo International (MFI) for Rs. 166 apiece on March 15 and 16, 2021. Ten or eleven days later, Axis businesses (Axis Capital, Axis Securities, and Axis Bank) purchased the shares from MFSL and MFI for a price ranging between Rs 31.5 and Rs 32.12.

The identical equity share is valued differently depending on whether Axis Bank is the buyer or seller, as the IRDAI order noted.

“The transfer of shares was not done at fair market value determined on a uniform basis, which resulted in Axis Bank, a registered Corporate Agent of the Insurer, and its group companies receiving undue financial gain of significant amounts from such buy/sale of equity shares,” the order stated.

On October 13, 2022, the IRDAI penalized Axis Bank Rs 2 crore for failing to follow its instructions and for obtaining significant unauthorized gains through the sale of these shares.

FOR MORE INFO CLICK THIS SITE:https://learningsharks.in/

FOLLOW OUR PAGE:https://www.instagram.com/learningsharks/?hl=en

FacebookTwitterEmailWhatsAppTelegramShare

What is Money Market ?

They give lenders and borrowers a way to meet their urgent financial needs.

Money markets were frequently taken for granted as basic, low-volatility components of the financial system UNTIL issues emerged during the global financial crisis.

Banks, money managers, and retail investors can typically make secure, liquid, short-term investments through money markets, and borrowers including banks, broker-dealers, hedge funds, and non-financial firms can get low-cost capital through them. The word “money market” is an umbrella term that encompasses a variety of market types that differ based on the requirements of lenders and borrowers.

One effect of the financial crisis has been to draw attention to the variations across distinct money market segments, some of which have proven to be fragile while others have shown considerable resilience.

For the short term

These exchanges are referred to as “money markets” because the assets that are purchased and sold have short maturities—ranging from one day to one year—and typically may be converted into cash with ease. Bank accounts, including term certificates of deposit, interbank loans (loans between banks), money market mutual funds, commercial paper, Treasury bills, securities lending and repurchase agreements (repos), and other financial instruments are all included in money markets. According to the Federal Reserve Board’s Flow of Funds Survey, these markets make up a sizable portion of the financial system in the United States, accounting for nearly one-third of all credit.

These money market instruments, many of them securities, differ in how they are traded and are treated under financial regulatory laws as well as in how much a lender relies on the value of underlying collateral, rather than on an assessment of the borrower.

The most familiar money market instruments are bank deposits, which are not considered securities, even though certificates of deposit are sometimes traded like securities. Depositors, who are lending money to the bank, look to the institution’s creditworthiness, as well as to any government programs that insure bank deposits.

Since collateral is not used to secure interbank loans, a lender must solely rely on a borrower’s creditworthiness to determine the likelihood that they will be repaid. The interbank market in England, where the London interbank offered rate (LIBOR), which reflects the average price at which large banks are ready to lend to one another, is the one that receives the most attention. During the crisis, that market did not prove to be a dependable source of funding. Once the credibility of banks was questioned, LIBOR rates jumped significantly in compared to other money market rates. Additionally, lending volume considerably reduced as banks struggled to fund their current assets and showed less enthusiasm in making new loans. Central banks’ emergency lending assisted in making up for this funding source’s contraction.

The integrity of the pricing methodology used to calculate LIBOR has also come under scrutiny in recent regulatory inquiries.

Commercial paper is a promissory note (an unsecured debt) issued by some sizable nonfinancial firms and highly rated institutions. Investors rely exclusively on the trustworthiness of the issuer to repay their savings because the instrument is unsecured (basically just a promise to pay, hence the name). Like a security, commercial paper is issued and traded. However, it is exempt from most securities rules because it is short-term in nature and not bought by individual investors. Here in the United States,For instance, commercial paper is issued in denominations that are judged too big for retail investors (usually $1 million, but occasionally as low as $10,000) and with maturities ranging from 1 to 270 days.

The safest investment

Government-issued securities with maturities of less than a year are known as Treasury bills. The safest investment for short-term savings is U.S. Treasury bills, which are actively bought and traded once they are issued and are sold at a discount from face value. The trading is governed by securities rules and takes place on a deep and liquid market. US Treasury bills can be used to settle transactions as well as serve as a savings instrument. Electronically issued Treasury Bills can be transferred through the payments system much like cash.

The money markets include a significant, although more intricate, section known as repos. Repos provide affordable interest rates for short-term borrowing and lending—typically no more than two weeks and frequently overnight. In exchange for cash, a borrower sells a security it owns with the promise to buy it back from the buyer—effectively a lender—at a later date and for a price that represents the interest paid for borrowing during the time period. The transaction’s central security acts as collateral for the lender.

Repo and other securities loan markets are essential to short-selling, which is when a trader agrees to sell a security they do not own, in addition to making it feasible for secure short-term borrowing and lending in money markets. The short-seller must temporarily borrow or purchase such a securities through a repo transaction. The short seller must once more purchase or borrow the security when it is time to return it to the lender. The short-seller benefits from the deal if the price has declined.

Companies that invest in various money market products, such as commercial paper, certificates of deposit, Treasury bills, and repos, sell securities known as money market mutual funds (MMMFs). In the United States and the European Union, money market mutual funds are governed as investment firms. They provide enterprises, institutional investors, and ordinary investors with a low-risk return on a short-term investment. A typical MMMF makes investments in highly rated, liquid, short-term instruments. The fund is managed to keep the price constant, or, in terms of securities, maintains a consistent net asset value, which is typically $1 per share, despite the fact that the price is neither fixed nor guaranteed. (This contrasts with other mutual funds, whose per share value fluctuates daily and invest in stocks or bonds)

The difference is paid as interest if the underlying MMMF assets’ value increases over $1 per share. A money market fund with a net value of less than $1 per share, or “breaking the buck,” was practically unheard of prior to the financial crisis. The fund’s investment managers utilized their own funds to maintain the price at $1 per share the few times it occurred.

However, losses on commercial paper and later notes issued by Lehman Brothers (the broker-dealer that filed for bankruptcy in September 2008) put money market funds at risk during the financial crisis. The U.S. government took measures to avert a panic that may have led the credit contraction to spread because MMMFs are significant players in other critical money markets. To help MMMFs fend off an investor run, the U.S. Treasury guaranteed the principal and the Federal Reserve established a special lending facility for commercial paper.

Dysfunctional markets

The money market has other segments that are less straightforward. They include certain triparty repo agreements and asset-backed commercial paper (ABCP).

A company that has illiquid (difficult to sell) financial assets like loans, mortgages, or receivables may use ABCP to borrow money at a reduced rate of interest or to get rid of these assets from its balance sheet. It establishes a special purpose business that buys the firm’s illiquid assets and pays for the transaction by issuing ABCP, which, in contrast to standard commercial paper, is “backed” or secured by the underlying assets. If the assets are rated well and the special facility has enough capital and credit lines, this sort of commercial paper can get a high credit rating. The lines of credit account for the difficulties of selling the underlying assets to meet financial needs, and the capital is meant to cover unforeseen losses on the assets.

During the crisis, there were issues in several segments of the ABCP market. Investors can easily evaluate an issuer’s credit condition because standard commercial paper issuers—almost entirely major nonfinancial firms and banks—file quarterly financial statements. The special purpose entity’s structure, its credit improvements, its liquidity backup, and the value of the underlying assets, among other factors, all of which were likely to be less transparent and more complicated than those of the plain commercial paper, all affected the credit risk on ABCP. Between August and November 2008, the ABCP market in the US shrank by 38%.

More than one-third of all outstanding commercial paper is held by the MMMF market, which was impacted by this. The money in MMMFs abruptly shifted away from ABCP and into government and agency assets when investors started to withdraw their money.

For Treasury and agency assets, the triparty repo market turned out to be substantially less dependable than the regular repo market. When a loan is repaid, ownership of the collateral is transferred from the borrower to the lender and back again by one or two clearing institutions, which control the triparty repo market.

FOR MORE INFO CLICK THIS SITE:https://learningsharks.in/

FOLLOW OUR PAGE:https://www.instagram.com/learningsharks/?hl=en

FacebookTwitterEmailWhatsAppTelegramShare

FacebookTwitterEmailWhatsAppTelegramShare

TOP 10 STOCK TRADERS TO FOLLOW ON INSTAGRAM

One of the best aspects of the emergence of online trading and investment platforms over the last decade or so is that they have empowered individuals to take hold of their financial future

These platforms have freed traders and investors from having to rely on middlemen in the financial services industry to carry out their investment decisions. Retail traders can now easily access clear and up-to-date market information and make investments in accordance with their personal preferences.

The emergence of social media has given rise to a new generation of commentators in the trading and investment arena at the same time that these platforms have made trading and investing more accessible than ever.

This new generation of trading and investment influencers finds it easier than ever to share their thoughts on trading, investing, and personal finance thanks to social media.Despite some criticism, it appears that this new generation of trading and investment professionals is here to stay given the popularity of several platforms.

WHY FOLLOW INVESTORS ON INSTAGRAM?

The trading, investment, and personal financial spheres were often rather traditional places dominated by conservative voices and practises before the new generation of online influencers arrived.

This has made way for a thriving and multicultural community where everyone can join in and add to the discussion regardless of who they are, what their background is, or what experiences they have.

Social media offers today’s investors a speedier, more effective way to learn about market movements in addition to being a more inclusive area with a more wide assortment of contributions. Another advantage of social media is that it is generally cost-free to use. This implies that you will be able to get current information to develop or assess trading and investment decisions regardless of who you are or what your financial situation is.With these advantages in mind, we have put together a list of some of the top stock traders on Instagram for this post. The most well-known, diversified, and genuine voices in the Instagram trading and investment field have been selected for this list. It also contains a variety of other resources that are crucial for anyone trying to understand the stock market better.

TOP 10 STOCK TRADERS TO FOLLOW ON INSTAGRAM

1. STOCK SHARKS (@STOCKSHARKS)

Followers: 1,200,000

An impressive 1.2 million people follow the prominent trading and investing Instagram account Stock Sharks on the platform. The profile is a component of Stock Shark Research, a company that focuses in performing in-depth research and offers learning materials and community support for beginning and intermediate traders. Members have access to in-depth research on some of the biggest corporations in the world through this subscription-based network.

The Stock Sharks Instagram page is a fantastic way to get to know this group; it has regular updates and commentary on well-known businesses that have hit the news. These are an excellent tool for anyone looking to grasp how to analyse financials and the commercial side of business.

2. STOCKSTOTRADE (@STOCKSTOTRADE)

Followers: 144,000

StocksToTrade may be the Instagram account for you if you’re seeking for a trading platform and community that works to help day traders block out market noise. StocksToTrade has a sizable 144,000+ followers on Instagram and posts daily updates there.

For those of you who aren’t quite ready to sign up, the StocksToTrade Instagram account nevertheless offers a wealth of free insights. It serves as a jumping-off place for its trading community. This has a good balance of market comments and trading tips. A fair supply of memes and “Trader of the Week” awards can also be expected from followers. The StocksToTrade website’s many features include links to “Breaking News Chat,” “free watchlists,” and “StocksToTrade University.”

3. STEVE BURNS (@SJOSEPHBURNS)

Followers: 285,000

Steve Burns is a prominent figure in a new generation of traders and stock market enthusiasts that has just developed, having amassed more than 285,000 followers on Instagram alone. Most notably, Steve Burns founded “New Trader U,” a well-liked trading community and resource used by thousands worldwide.

Steve Burns is a seasoned trader and stock market observer with almost three decades of expertise in the financial markets. In addition to writing multiple books on trading and investment technique, he has penned thousands of articles on stock trading. The best place to find out more about Steve Burns’ trading philosophy is undoubtedly on his Instagram account.

Steve Burns shares daily market analysis and updates on his Instagram account, with a focus on how stock investing can help you become financially independent. We advise adding this Instagram feed to your timeline if achieving financial independence appeals to you.

4. NATHAN MICHAUD (@INVESTORSLIVE)

Followers: 38,400

Nathan Michaud, a day trader who is also highly active on Twitter, has started to use Instagram more and more to give daily information to his thousands of devoted followers. Followers can find an experienced day trader on this profile who has spent the last few years assisting the thousands of members of his trading community in achieving their trading objectives.

‘Investors Underground’ is a day trading community that offers stock watch lists that are updated every day during the trading week. It was founded by Nathan Michaud. Here, you can find a lively discussion room, stock trading video tutorials, and webinars. We really enjoy his “Sunday Scan,” which outlines some of his ideas.

If you want to learn more about an active trading community or are interested in Nathan Michaud’s fair assessments of the health of the stock market, follow him on Instagram. Even while Michaud does not directly offer trading advice or methods through his account, it nevertheless serves as a fantastic launchpad for the neighbourhood that has developed around him.

5. MARKETWATCH (@MARKETWATCH)

Followers: 381,000

Another immensely helpful source for news and market updates, MarketWatch offers its users a constant stream of statistics, charts, and graphs throughout the trading day. It has become particularly well-liked due to the regularity of its updates as well as the potent illustrations it use to explain densely detailed financial information. This Instagram account has been emphasising longer-form video footage recently, which enables more commentary and analysis.

A well-known website called MarketWatch offers financial data, information, business news, and analysis. It was founded by Mark DeCambre in 1997 and is currently a division of News Corp.’s Dow Jones & Company.

The MarketWatch Instagram account and website are excellent resources to expose oneself to more raw market data, such as charts and graphs, if you have discovered that you lack data literacy. This information can frequently be fairly challenging to interpret for many beginning and intermediate traders. The MarketWatch staff, however, takes great care to make sure all reporting is as clear as possible. In fact, we wholeheartedly encourage following MarketWatch on Instagram if you’re a novice trying to advance your knowledge and skills or a more seasoned trader looking to keep yourself sharp.

6. PETER SCHIFF (@PETERSCHIFF)

Followers: 111,000

Peter Schiff is a prominent figure in business. He is an American stock broker, best-selling author, and financial analyst who has built a name for himself for his consistently perceptive and frequently divisive viewpoints. Many of these viewpoints are expressed via his well-liked podcast, The Peter Schiff Show, which is complimented by his active social media accounts on Twitter and Instagram.

The information on Peter Schiff’s Instagram account is invaluable for both beginning and experienced traders. Throughout the day, he frequently writes brief market updates, the most of which are analyses of the health of the world economy at the time. The fact that Schiff correctly predicted the global financial crisis in 2008 has contributed to his rise to prominence in the field.

Peter Schiff’s Instagram account is a crucial resource if you want to get sharp analysis of the health of the economy that frequently contrasts with the more popular commentary you will see. Become one of his 110k+ followers and add some scathing criticism to your social media feed.

7. MORNING BREW (@MORNINGBREW)

Followers: 544,000

The Morning Brew Instagram account is a terrific alternative if you haven’t already signed up for their hugely popular newsletter, which had over 4 million readers in 2021 and generated $50 million in yearly income. @morningbrew is updated throughout each day and includes content that is relevant to the daily email, serving as an excellent supplement or replacement for the newsletter.

One of the most popular online newsletters to launch in recent years is The Morning Brew. It covers all of the most recent developments in business, from Wall Street to Silicon Valley, in its daily updates.

The Morning Brew Instagram feed is a great place to follow if you want to stay up to date on the newest developments in business, as it offers daily updates in a fun and irreverent manner. As a result, information that can frequently be fairly complex is made simple to understand.

8. FINANCIAL TIMES (@FINANCIALTIMES)

Followers: 2,800,000

Even though this account doesn’t quite qualify as a “trader” for one person, it is still unquestionably among the most valuable ones you can add to your Instagram timeline. The Financial Times is undoubtedly one of the few authoritative voices in the fields of finance, trade, and investing. In its more than 100-year history, the Financial Times has made a name for itself as one of the most trustworthy sources of information on international markets in addition to being a major voice in the financial and investing industries.

The Financial Times’ Instagram page is a fantastic resource for individuals without a subscription to the Financial Times website or newspaper and wonderfully complements its other paid tools. Throughout the trading day, the page is updated numerous times with the most recent information. When developing and implementing your trading and investment strategies, keep this crucial background knowledge in mind.

9. BLOOMBERG BUSINESS (@BLOOMBERGBUSINESS)

Followers: 4,600,000

The Bloomberg Business account is another one that should certainly be on the timeline of any self-respecting stock trader. This is without a doubt one of the most significant sources of knowledge in the sector, even though there may not necessarily be any direct trading or investing advice here.

The editing and publishing division of the Bloomberg group, a New York City-based financial, software, data, and media firm, includes Bloomberg Business. The Bloomberg firm is so pervasive in the financial industry that practically every employee in the financial services industry uses its computer software programme, the Bloomberg Terminal. As a result, Bloomberg is now regarded as one of the most reliable brands in the trading, investing, and financial services industries.

10. NOT YOUR FATHER’S BROKER (@NOTYOURFATHERSBROKER)

Followers: 251,000

Regrettably, the world of trading and investing may occasionally be stressful. Given the inherent volatility of the markets and the fact that you would certainly like for the value of your investments to increase rather than decrease, this is usually unavoidable. Given that this anxiety is unavoidable, it’s critical to discover healthy coping mechanisms for stress management and distraction from the ups and downs of the markets.

A comedy-based finance account called Not Your Father’s Broker publishes and disseminates memes, jokes, and other materials that are all related to the world of finance.

Since humour is the ideal remedy for some of the worry and anxiety that can accompany news about the stock market, we chose to include the Not Your Father’s Broker account. As noted, even though on the surface this is only a meme account for friends on social media to share jokes, there are a number of lessons you can learn from the regular postings from this account.

FOR MORE INFO CLICK THIS SITE:https://learningsharks.in/

FOLLOW OUR PAGE:https://www.instagram.com/learningsharks/?hl=en

What is Bear Market ?

The scariest market occurrences you’ll experience are bear markets, which occur when an asset’s value drops 20% from recent highs. However, long-term investors are able to persevere.

Many investors experience panic when they hear the term “bear market”. However, these severe market downturns are inevitable and frequently only last a short while, especially when contrasted to the length of bull markets, during which the market is appreciating in value. Even in bear markets, there are lucrative investing possibilities.

More information on what a bear market entails and precautions you can take to ensure your portfolio endures (and perhaps even flourishes) until the bear turns into a bull are provided below.

What is a Bear Market?

An extended decline in investment prices is what is known as a bear market; typically, a bear market is when a broad market index declines by 20% or more from its most recent high. A bull market, which is defined by gains of 20% or more, is the opposite of a bear market.

While 20% is the cutoff, bear markets frequently plunge much more than that over an extended period of time. A bear market may occasionally see “relief rallies,” but the overall tendency is negative. Pessimism and lack of confidence among investors are traits of bear markets. Investors frequently appear to disregard any positive news during a bear market and continue selling aggressively, driving prices farther lower.

Investors eventually start to discover attractively priced equities and start buying, effectively ending the bear market.

Bear markets are possible for both individual equities and markets as a whole, such as the Dow Jones Industrial Average. Investors’ negative sentiment about a certain stock is unlikely to have an impact on the market as a whole. However, practically all stocks inside a market or index start to decrease when it turns negative, even if they are all individually reporting positive news and increasing earnings.

How long do bear markets last, and what causes them?

Although it doesn’t always happen, a bear market frequently happens just before or after the economy enters a recession.

Investors closely monitor the hiring, wage growth, inflation, and interest rate indicators to determine when the economy is slowing.

Investors anticipate a short-term reduction in business profits when they observe a contracting economy. So, they sell equities, which causes the market to decline. A bear market may portend increased unemployment and difficult economic circumstances.

In general, bear markets last 363 days on average as opposed to 1,742 days for bull markets. According to data gathered by Invesco, they also tend to be statistically less severe, with average losses of 33% compared with bull market average gains of 159%.

1. Make dollar-cost averaging your friend

Let’s say a stock in your portfolio sees its price fall 25%, from $100 per share to $75 per share. It can be tempting to try to buy when you think the stock’s price has fallen if you have money to invest and want to purchase more of this stock.

Unfortunately, you’ll probably be in error. It’s possible that the stock hasn’t fallen 50% or more from its high; instead of bottoming out around $75 per share. Attempting to “time” the market or “pick the bottom” is perilous because of this.

A more conservative course of action is to consistently contribute funds to the market using a technique called dollar-cost averaging. You consistently invest money over time and in about equal amounts when you use dollar-cost averaging.

As a result, your purchase price is smoothed out over time, preventing you from investing all of your money in a company at its peak (but still profiting from market falls).

Bear markets can undoubtedly be frightening, but the stock market has shown over and again that they eventually end.

2. Diversify your holdings

Speaking of purchasing stocks at a discount, increasing your portfolio’s diversity to include a variety of assets is another wise move, down market or not.

During bear markets, all the companies in a specific stock index, like the S&P 500, often decline, but not always by the same percentages. A well-diversified portfolio is essential because of this. The overall losses of your portfolio are reduced if you have a mix of relative winners and losers in your portfolio.

If only you could predict who would win and lose. Investors frequently select assets that give a steadier return during these times since they typically occur before or concurrently with economic recessions. This is true regardless of the state of the economy.

The following investments could be included in your portfolio as part of this “defensive” strategy:

stocks that provide dividends. Many investors still desire dividend payments even when stock values aren’t rising. Investors will therefore be drawn to businesses that offer higher-than-average dividends during downturn markets. (Are dividends of interest? See our list of stocks with large dividends.)

Bonds. Because they frequently move in the opposite direction from stock prices, bonds are also a desirable investment during uncertain times in the stock market. Any portfolio must include bonds, but adding more short-term, high-quality bonds to your holdings may lessen the impact of a down market.

3. Invest in sectors that perform well in recessions

What investments are profitable during a bear market? Consider the products that consumers will always need because those industries typically do well when the market is weak. People still need petrol, groceries, and healthcare even in times of high inflation, therefore commodities like consumer staples and utilities typically fare better in bear markets than other commodities.

Through index funds or exchange-traded funds that follow a market benchmark, you can invest in particular industries. For instance, investing in a consumer staples ETF can expose you to businesses in that sector, which is more stable than others during recessions. Because each fund owns shares in numerous firms, investing in an index fund or ETF offers greater diversification than buying a single stock.

4. Focus on the long-term

All investors are put to the test during bear markets. Even while these times are difficult to endure, history indicates that the market will most likely rebound rather quickly. Additionally, the downturn markets you’ll experience if you’re investing for a long-term objective—like retirement—will be eclipsed by bull markets. You shouldn’t invest money you need for short-term goals, often those you intend to accomplish in fewer than five years, in the stock market.

Even yet, one of the finest things you can do for your portfolio is to resist the urge to sell investments when markets fall.

You can have a robo-advisor or a financial advisor manage your investments for you in both good and bad times if you struggle to keep your hands off them during a bear market.

Bear markets are, in the end, an excellent opportunity to review your goals and objectives and to remind yourself of the reasons you are invested where you are. Stay the course if your asset allocation feels appropriate. If something seems out of place, a down market might present a chance to reset your accounts while paying less capital gains tax than you would in a bull market.

Conclusion

When stock prices drop 20% or more from a recent high, it might be frightening, but investors shouldn’t panic.

The typical bear market lasts less than a year, and investors can lessen its effects by utilizing straightforward strategies like dollar-cost averaging, diversification, investing in areas that are more resilient to recessions, and putting a priority on the long term.

FOR MORE INFO CLICK THIS SITE:https://learningsharks.in/

FOLLOW OUR PAGE:https://www.instagram.com/learningsharks/?hl=en

FacebookTwitterEmailWhatsAppTelegramShare

FacebookTwitterEmailWhatsAppTelegramShare

What is Investment Management ?

What Is Investment Management?

Investment management includes more than just purchasing and selling financial assets and other investments. Creating a short- or long-term strategy for the acquisition and sale of portfolio holdings is a component of management. It may also cover banking, budgeting, and tax-related services and obligations.

The phrase most frequently relates to managing the holdings within a portfolio of investments and trading them to accomplish a certain investment goal. Money management, portfolio management, and wealth management are other terms for investment management.

Advantages and Disadvantages of Investment Management

Managing a company in the investment management sector has its challenges despite the potential for rich profits. The performance of the market has a direct impact on the earnings of investment management companies.

The company’s profits are therefore directly correlated with market valuations. A significant drop in asset values may result in a fall in the company’s revenue, particularly if the price drop is significant relative to the ongoing and constant operating expenses. Additionally, during recessions and weak markets, clients could lose patience, and even above-average fund performance might not be enough to keep a client’s portfolio afloat.

Pros

Expert analysis

Constant diligence

Ability to beat or time the market

Capacity to protect a portfolio during a slump

Cons

Significant costs

Profits vary with the market

issues with robo-advisors and passively managed vehicles

The sector has also faced difficulties from two more sources since the mid-2000s.

The rise of roboadvisors, or online services that offer asset allocation and investment methods that are automated and driven by algorithms.


Exchange-traded funds (ETFs) with portfolios that closely resemble benchmark indices are readily available.


The latter is an example of passive management because it requires fewer human fund managers to make investment decisions. The only human involved in the first challenge is the programmer who created the algorithm. Both are therefore able to charge much cheaper costs than traditional human fund managers. However, other studies indicate that because they don’t have high fees weighing them down, these less expensive options frequently outperform actively managed funds—either outright or in terms of overall performance.

Investment management organizations are under pressure from this dual rivalry, which is why they need to attract skilled, knowledgeable individuals. While some clients examine the success of certain investment managers, others examine the firm’s overall performance. Not only how much money a customer makes in prosperous times, but also how little they lose in difficult times, is a crucial indicator of an investment management firm’s competence.

FOR MORE INFO CLICK THIS SITE:https://learningsharks.in/

FOLLOW OUR PAGE:https://www.instagram.com/learningsharks/?hl=en

FacebookTwitterEmailWhatsAppTelegramShare