Learning sharks-Share Market Institute


Rajouri Garden  8595071711 7982037049  Noida 8920210950 , and  Paschim Vihar  7827445731  

Fee revision notice effective 1st April 2025; No change for students enrolled before 15th May 2025

Download “Key features of Budget 2024-2025here

Manappuram Finance falls 14% after the ED freezes assets worth Rs 143 crore.

When the RBI discovered the same and asked the accused to restore the amount to the depositors, the accused answered to the RBI that they have repaid the money to the depositors, but an ED probe revealed that there is no proof of payback or no KYC of the depositors, the ED claimed.

Manappuram Finance Ltd’s shares fell 14% in early trade, trading at Rs 103 on the BSE at 9:32 a.m., after the Enforcement Directorate froze the assets worth Rs 143 crore of the major Kerala-based NBFC’s MD and CEO VP Nandakumar in a money laundering case.

According to the ED, the proceeds of the crime were “diverted and invested” by Nandakumar into immovable assets in his name, the names of his spouse and children, and shares of Manappuram Finance Ltd.

The frozen assets include deposits in eight bank accounts, investments in listed shares, and shares of Manappuram Finance Limited, according to the agency. Various “incriminating” documents demonstrating money laundering, as well as property documents for 60 immovable properties, were also seized during the searches.

  • It stated that “evidence” of money laundering and large-scale cash transactions in the form of public deposits carried out without RBI authorisation by Nandakumar through his proprietary entity Manappuram Agro Farms (MAGRO) had been collected.
  • The deposits were “illegally” acquired by Nandakumar through some of the staff of Manappuram Finance Limited, a listed firm.

“The outstanding illegally collected deposits, which are crime proceeds, total Rs 143 crore.”

the accused answered to the RBI that they had repaid the money to the depositors, but an ED probe revealed that “there is no proof of repayment or no KYC of the depositors,” the ED claimed.

Deposits totaling Rs 53 crore are reported to have been returned in cash, but with no proof of repayment or KYC, according to the report.

The role of Manappuram Finance Limited’s chief finance officer (CFO) and other staff accused of assisting in money laundering is being scrutinised, according to the agency.

After beating expectations for the March quarter, Cholamandalam Investment rose 9%.

Cholamandalam Investment and Finance Company, a member of the Murugappa Group, increased by over 9% on May 4 following the release of better-than-anticipated profits.

On May 4, after the company released higher-than-expected earnings, shares of Cholamandalam Investment and Finance Company, a member of the Murugappa Group, increased by almost 9%. This accomplishment was substantially enhanced by the rapid growth in disbursals and collections.

Cholamandalam Investment was trading at Rs 960 on the BSE at 9.30 a.m. on Thursday, up 8.3 percent from its previous finish, while the Sensex was up 0.11 percent to 61,262.39 points.

JP Morgan has upgraded the company to ‘overweight’ from ‘underweight’ following solid earnings and boosted its target price to Rs 1,020 from Rs 700 per share. Macquarie has upgraded the stock to ‘outperform’ and raised the target price to Rs 860 per share.

According to Jefferies India, Cholamandalam Investment is their top pick, with a target price of Rs 900 per share, unchanged from its current market price.

However, Elara Securities downgraded the stock to ‘accumulate’ from ‘buy’ and maintained a target price of Rs 930 per share, up 5% from its current market price.

During the March quarter, the company’s standalone net profit increased by 24% to Rs 853 crore, up from Rs 690 crore the previous year.

It also announced that it has increased its market share in both auto finance and other business areas. Total assets under management increased by 36% to Rs 112,782 crore in FY23, up from Rs 82,904 crore in FY22.

Elara, a brokerage firm, forecasts a 25% AUM CAGR in FY23-25, citing macro tailwinds and new growth engines in place.

The ratio of Stage 3 (S3) assets reduced by 50 basis points (bps) QoQ, reaching 3.0 percent, while the ratio of Gross Non-Performing Assets (GNPA) decreased by 74 bps, reaching 4.6 percent (based on Income Recognition and Asset Classification or IRAC). Furthermore, credit costs fell by 25 basis points year on year.

“Taking advantage of macro tailwinds, CIFC has been a consistent outperformer, striking a fine balance between healthy growth and NIM management.

Expect a 25% AUM and a 22% earnings CAGR in FY23-25, with an average NIM of 7% and a healthy return profile (2.6 percent ROA/20% ROE).

“CIFC will now be reckoned as a steady-state compounder story, commanding a rich multiple,” Elara Securities stated in a recent note.

Nifty retreats following a six-day rally; 18,000 is key to direction

The Nifty50 is likely to stay in the region of 18,000 to 18,200 in the near future, according to Rupak De of LKP Securities. He suggested that the index may climb towards 18,500 with a strong advance above 18,200.

After a one-way 600-point run from 17,550 to 18,150, the Nifty50 dipped for the first time in seven straight sessions, but concluded with modest gains on May 3.

Technology, metal, oil & gas, and a few equities in the banking & financial services industry have all experienced corrections.

  • As a result of session-long volatility, the index, which had started the day at 18,114, was controlled by bears. On the daily charts, a bearish candle with a lower shadow was formed as it closed at 18,090, down 58 points.
  • After a six-day rally and in anticipation of the outcome of the Federal Reserve’s two-day meeting tonight, the profit taking and cautious trading followed the predicted patterns.
  • The psychological 18,000-mark is anticipated to act as a crucial area for further direction, so if it breaks that level, then 17,900-17,800 can be possible levels on the downside, whereas on the other side, 18,200-18,500 zone on the higher side can be seen, experts said. Given the trend, this is just a normal retreat.

After a cautious beginning as investors awaited the Fed’s rate announcement, the Nifty remained largely rangebound. A little candle with a red body has formed on the daily chart. As long as the index continues over 18,000, sentiment will remain optimistic, according to Rupak De, Senior Technical Analyst at LKP Securities.

He believes that the index will likely stay in the 18,000–18,200 region in the near future.

Prior to weekly expiry, the Nifty50 saw maximum Call open interest at the 18,200 strike, which is anticipated to be a significant hurdle moving forward. This was followed by strikes between 18,100 and 18,300, with notable Call writing at 18,100 and 18,200 strikes.

  • The 18,000 strike, which is likely to provide immediate support for the index, had the highest open interest on the put side, followed by the 17,900 and 17,800 strikes.
  • “The open interest (OI) statistics for both the indices (Nifty50 and Bank Nifty) going into tomorrow’s expiry are mixed, with the Nifty OI data showing more Call open interest and the Bank Nifty OI data showing more Put writing.
  • From 17,850 to 17,500 odd levels, there is strong demand for the Nifty index.

On a daily basis, the index has developed a respectable bullish candlestick pattern, and the momentum indicator MACD (moving average convergence divergence) has shown a great positive crossover, indicating that the trend is continuing upward even though there has been a little correction today.

“At 43,150, immediate support is apparent. A move above 43,500, though, might spark a surge towards 44,000, he continued.

In the next 12 to 24 months, I’ll make a decision on UK assets: CEO and MD of Tata Steel TV Narendran

The company’s top executive warned that, in the worst event, various assets would be shut down as they approached end-of-life if the UK government did not support a green transition.

Chief Executive Officer and Managing Director of Tata Steel TV Narendran

The assets are nearing the end of their useful lives and cannot last for much longer. In a year or two, we will need to make a decision, according to TV Narendran, Tata Steel’s CEO and managing director.

Financial information on the last UK Government proposal was withheld by Tata Steel. In the past, media sources have estimated it to be worth £600 million for two businesses, including Tata Steel UK.

Tata Steel stated in a May 2 note for its March quarter financial results that it was closely monitoring the progress of discussions with the UK government because it was still unclear, based on initial and subsequent discussions, whether adequate support for the decarbonization strategy would be reached.

We are unable to finance the shift due to the company’s cash flow. The government has responded with a package that is not even close to what we are requesting, therefore discussions are still ongoing, according to Narendran in the interview from May 3.

The corporation receiving the package it seeks would represent the assets’ best-case scenario, he continued. The UK has a glut of scrap and is exporting it, which is our main argument.

Why shouldn’t a nation use that (junk) in the production of steel? he said.

  • If there was no package, he continued, “…we will have to close them as and when separate assets come to end-of-life. If an asset is unsafe, we cannot manage it.
  • It seems obvious that more upstream assets, particularly those that are vital, will expire over the next two years.

In FY22, 3.5 million tonnes of liquid steel were produced at Tata Steel’s Welsh Port Talbot Steel Works, which is operating at a loss.

A stock trader from Bengaluru seeking help from NIMHANS after losing Rs. 30 lakh

The individual made the choice to seek advice from experts at the Service for Healthy Use of Technology (SHUT) clinic after suffering a trading loss of more than Rs 30 lakh.

The trader had already suffered significant losses, but because of his excessive trading, he had spent all of his life’s savings and even had to borrow money.

(Representative Photograph).

The de-addiction clinic at the National Institute of Mental Health and Neurosciences (NIMHANS) in Bengaluru was contacted by a 39-year-old man who wanted to get assistance for his addiction to stock market trading and investing.

The Times of India quoted Dr. Manoj Kumar Sharma, professor of clinical psychology and coordinator of the SHUT clinic, as saying, “Unlike other cases like gambling or gaming addiction, we had to take a fresh approach to address the patient’s situation by understanding his problem in detail, as it was a first-of-its-kind case for us psychologists too.

In the past, the man had made accurate stock market predictions, the doctor said.

Although he had already suffered significant losses, the man’s excessive trading led him to spend all of his life’s savings and even force him to borrow money.

Stock trading issues are not within the purview of SHUT’s professionals, they acknowledged, but this was a dysfunctional issue.

  • Given that the patient does not have any impulsive problems that call for medication, treating stock trading obsession is difficult for us.
  • According to a renowned psychologist, there are two important considerations to consider in this situation: whether the person should completely stop trading or just engage in it in moderation.

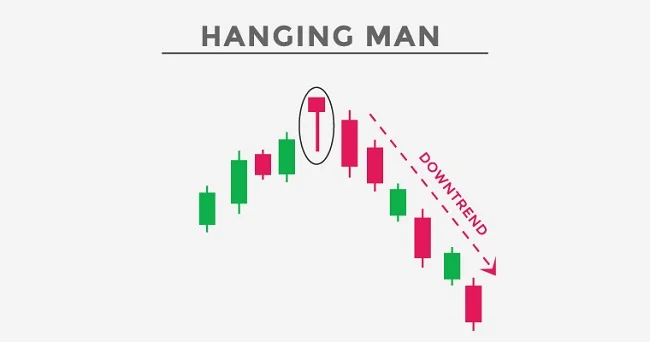
What is Hangingman Candlestick Pattern in Crypto?

A potential reversal in an uptrend can be indicated by the attractive candlestick pattern known as the “hanging man.”

It’s not as scary as it sounds, so don’t worry. This pattern, which is a reversal pattern, really indicates that the market may be turning negative.

Understanding Candlestick Charts and Data Points

The open, close, high, and low are the four important data points that assist us comprehend what is happening. These facts help traders understand the ongoing struggle between the market’s bulls (buying) and bears (sellers).

You’ll be aware of a prospective market change the next time you see a hanging man!

Exploring the Appearance of the Hanging Man

Actually, it’s a single candlestick pattern that denotes a likely market reversal. Although there shouldn’t necessarily be an uptrend before this pattern appears, there should be some observable price growth.

How little the actual body is is what counts. There are many different shadow configurations, such as none, top and bottom shadows of the same size, or even elongated shadows on either end. Other candlestick patterns, such as the morning and evening star, can include these spinning tops.

However, it is referred to as a hammer if it does so following a price decline or during a downtrend. And what’s this? The meanings of these two motifs are completely different! To accurately grasp them, you must pay close attention to where they appear on a price chart.

Constructing the Hanging Man: Key Features

Regarding the upper shadow, it might or might not be present. If it does appear, it will be quite little. However, the hanging man typically lacks an upper shadow, so the open or close and the high are identical. So there you have it: the hanging man, with his small genuine body, long lower shadow, and typically absent above shadow.

A Quick Recap: The Hanging Man’s Role in Market Reversals

The high, low, opening, and closing prices for a specific time period serve as a kind of snapshot of how investor sentiment is affecting the pricing of an asset.

The candle must also have a lengthy lower shadow and a small true body. You have a hanging guy on your hands when all of these circumstances come together, and it’s time to keep an eye out for any prospective changes to the market!

Circle Launches Cross-Chain USDC Protocol; France Explores Fast- Tracking EU Compliance for Crypto Firms

Top 5 stories chosen this week to keep up with the crypto industry.

the trend being led by the UK. According to a research from the investing firm for digital assets, CoinShares, released in March of that year, the UK’s cryptocurrency market saw the most growth globally in 2021.

Circle introduces cross-chain USDC protocol

The Cross-Chain Transfer Protocol (CCTP), created by Circle, enables developers to transfer the USDC stablecoin quickly between Ethereum and Avalanche.

In essence, CCTP does away with the requirement for Circle partners or outside bridges to transport data between these networks.

Users will be able to “burn and mint” or “teleport” USDC between blockchains via apps that employ CCTP, claims Circle.

1. 2020 is a good indicator of 2024 and beyond

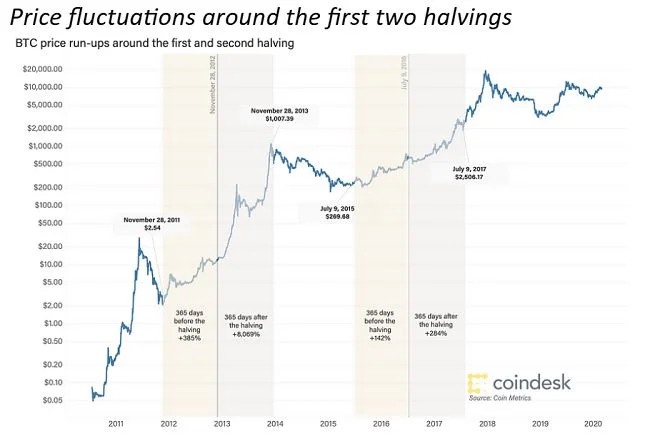
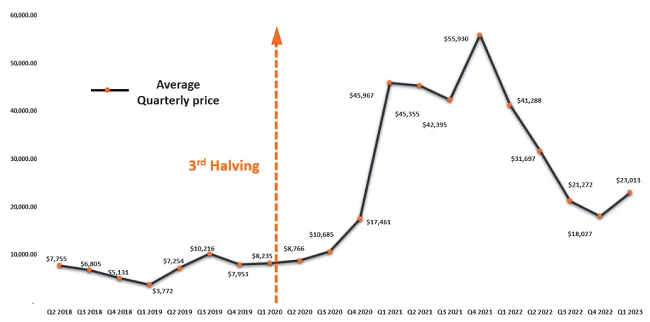
Due to BTC’s slow acceptance, the first two price halves in 2012 and 2016 were not as dramatic. However, the price increased noticeably both before the event and after it, both of which occurred gradually.

Price swings surrounding the first two halvings

The halving in 2020 is probably a good sign for how things might turn out in 2024.

Price was stable before the 2020 price halving.

With the exogenous shock of the COVID-driven sell-off excluded, prices were almost steady prior to the third halving. They then rose to an all-time high of $69,000 in November 2021, over 18 months after the incident.

2. BTC dominance is likely to increase strongly in the next 12 months

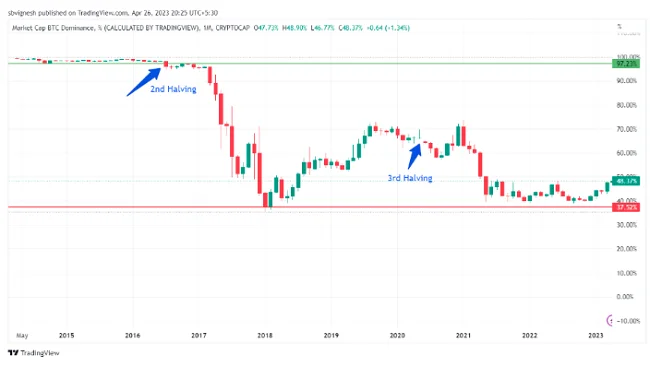
After the halving, it continued to rise for the following six months, and then altseason gained control in the first few months of 2021. Currently, Bitcoin holds a 48% market share.

Prior to a halving, BTC dominance rises; after the event, it declines.

3. Bitcoin halving has never occurred during a potential recession

The likelihood of one in 2023 is still high. If it does, we predict that the price of BTC would behave similarly to 2020, albeit on a smaller scale or with a few months’ delay.

The coronavirus epidemic was present during the 2020 halving, however it had little impact on the adoption of BTC. Beincrypto reports that the amount of Bitcoin exchanged and traded in early 2020 was 2,800% greater than it was in 2016.


What is OTC? A beginner’s guide to over-the-counter markets

OTC, or over-the-counter trading, provides chances like the affordable purchase of a new, high-potential company.

In this method, financial instruments like as stocks, bonds, and other securities are exchanged directly between two parties as opposed to on a stock exchange for the general public like the New York Stock Exchange (NYSE) or Nasdaq.

Michael Bertov, the author of The Evergreen Startup, adds that OTC gives you access to high-growth growing businesses, especially startups.

Additionally, as OTC investments often cost less than their public market counterparts, you receive more investment for your money.

What does OTC mean?

They are referred to as dealer markets or networks. Stock exchanges, in contrast, are auction marketplaces. Investors submit offers for stocks after an asking price (the “ask”) is posted, competing with one another.

This indicates that although its stock can be purchased and traded publicly, it is not listed on a significant exchange like the NYSE or Nasdaq. Therefore, these equities are bound by the guidelines and standards set by these exchanges for the listed corporations.

In fact, SEC rules were revised in September 2020 to improve disclosure and investor safety by requiring broker-dealers to refrain from publishing price quotes for a security when up-to-date information about that security is not immediately accessible to the general public.

OTC trading is also typically conducted through a registered broker-dealer. The Financial Industry Regulatory Authority (FINRA) oversees broker-dealers.

What kinds of investments trade OTC?

Since they don’t trade enough shares or their shares don’t sell over a minimum price, many small-company equities that are listed on major exchanges are OTC securities. They trade for less than $5 per share and are frequently referred to as penny stocks.

Other OTC companies are bigger, but they are unable to pay the listing fees that the major exchanges want (or don’t want to). For instance, organisations that meet the requirements can pay up to $167,000 to list on NASDAQ.

In addition to equities and bonds, investments that trade OTC frequently consist of:

  • Private agreements between two parties known as derivatives are frequently arranged by brokers. These can include forwards, futures, options, or other contracts whose value is determined by the value of an underlying asset, such as a stock.
  • international money. Every day, the Forex, an over-the-counter currency market, trades more than $6.6 trillion in currencies from various countries.
  • digital money, such as bitcoin and ethereum.

What are the major OTC markets?

OTC Markets Group is a significant over-the-counter (OTC) network. Depending on your broker, you as an investor will have access to this market. The Grey Market is another option, which we’ll discuss below.

OTC Markets Group

According to their size, share price, and frequency of financial reporting and transparency, over-the-counter equities are categorised into three categories by OTC Markets.

The following is the OTCQB® Venture Market, which is for start-up or growing enterprises and requires a minimum bid price of $0.01.

This category contains shell companies, overseas businesses, penny stocks, and other enterprises that opt not to publish their financial data.

Grey Market 

The term “grey market,” sometimes known as “other OTC,” refers to any security that is traded over-the-counter but is not quoted by broker-dealers for a variety of reasons, including a lack of investor interest, a lack of financial information, or a failure to comply with regulatory requirements.

Is it safe to buy OTC stocks?

OTC trading has had a shady reputation. Partly that’s because of the basic way it operates. OTC is a secret negotiation between a buyer and a seller, in contrast to the complete transparency of stock exchanges, where prices are made public.

It is not surprising that OTC markets have been the scene of fraud and illegal activity. Dealing in penny stocks allows for illicit pump and dump schemes, in which a stock is promoted (pumped up).

They genuinely run like “discount” stock exchanges, enforcing regulations, exercising monitoring, and, in the case of OTC Markets, categorising equities according to tiers.

Risks of OTC trading

Aside from fraudulent activity, OTC trading is also fraught with dangers.

  • Lack of price transparency. As mentioned above, a vendor might hypothetically charge one customer one amount for a security and name a different price to another.
  • Low liquidityThere isn’t much demand because many OTC equities are barely traded. This makes it challenging to sell them when you want to.
  • Volatility. OTC securities have a lower trading volume, which could cause sudden price changes.


How Are Stock Prices Determined: The Factors that Affect Share Prices of Listed Companies

Although we may receive a commission from the links our partners provide, our assessments and opinions are unaffected by our advertising connections. The editorial team at TIME did not contribute to the creation of this material.

Each share of stock in a publicly traded corporation, or one whose stock is exchanged on markets like the New York Stock Exchange and the Nasdaq, has a price. An investor owns a portion of the business for each share they purchase.

The price per share of a stock is mostly determined by supply and demand. The stock price often increases if demand for a constrained number of shares exceeds supply. Additionally, the stock price normally declines if supply exceeds demand.

Setting stock prices

William Haight, a director at Capital Choice Financial Group in Phoenix, said that the amount of a stock and how many people want it influence its price. “The price of a stock will increase if more people desire to acquire it. However, the price will decrease if more people decide to sell.

On the other hand, let’s take a look at RXYZ Co., a fictitious healthcare organisation. The stock might be trading at $45 per share on Monday. The next day, a Wall Street analyst publishes a negative report on the healthcare industry, which prompts some investors to sell their shares in RXYZ and causes the stock price to fall to $40 a share. That represents an 11% drop in one day.

What factors affect the share prices of listed companies?

Stock price variations are caused by a variety of factors, not just supply and demand. In actuality, a number of factors may combine to cause up and down swings in price.

Company activity

According to Haight, his increased demand may cause the stock price to climb. In contrast, if RXYZ reports poor financial results for the third quarter, investors may lose faith in the company and sell some or all of their RXYZ shares.

In addition, the following corporate events could cause a rise or fall in the stock price:

  • grant of a patent for a novel and exciting commodity or service.
  • international expansion’s launch.
  • unexpected demise of the CEO.
  • a significant client is lost.

The state of the economy

Investors may feel more optimistic about the path of the economy, for instance, if the U.S. Bureau of Labour Statistics releases data showing that the unemployment rate decreased and the nation added a significant number of jobs the previous month.

They might therefore be more motivated to invest in the stock market, which would raise the price of some companies’ shares.
Contrarily, poor employment and unemployment data may frighten some investors, triggering a stock sell-off that lowers share prices.

Inflation

As a result, investors may decide to sell some of their shares if the inflation rate is rising and they start to feel uneasy about the state of the economy. Investors may become more optimistic about the economy and increase their stock-buying activities, however, if the rate of inflation is declining.

Furthermore, a company’s financial performance could be negatively impacted by excessive inflation because purchasing goods and services will cost more. A company’s profits may be reduced by an increase in costs, which would deter investors and cause the stock price to fall.

Interest rates

The price that businesses pay to borrow money is significantly influenced by interest rates. High interest rates may increase the cost of company borrowing. As a result, company earnings might decline, which would lower stock prices overall.

In addition, stocks may not be as appealing as CDs, bonds, and other assets whose yields benefit from increased interest rates due to the higher interest rates on their stock market. Stock prices would decline if investors sold out.

Consumer spending

The Congressional Research Service asserts that “consumer spending is a key driver of short-run economic growth in the U.S. economy.”

The same holds true for company sales, earnings, and stock prices, which can all suffer from sluggish consumer spending.

World events

In 20 significant geopolitical crises, such as the attack on Pearl Harbour, President John F. Kennedy’s assassination, and the 9/11 terrorist attacks, between 1941 and 2020, the S&P 500 stock index declined on average by 5%, according to data from LPL Research.

According to IMF data, geopolitical risks between 1985 and 2020 caused a drop in stock returns ranging from 10.53% to 42.14%, which is consistent with this finding.

Major investors

Haigh remarked that changes in stock prices might be influenced by the behaviour of big institutional investors like mutual funds and hedge funds.These investors possess a lot of shares, so their buying and selling activities can have a big impact on stock prices, he said.

Why do stock prices change every second?

Investors may decide to purchase or sell a company’s stock when they learn new information about it, according to Haight. “The stock’s price increases if more individuals purchase it. The stock’s price will decrease if more individuals sell it.

Lean on professional advice

Your broker’s financial advisor can assist you if you’re unsure about what’s occurring in the stock market or whether to buy or sell shares. These experts can help guide you in the right way by attentively monitoring the ups and downs of the stock market.


Liquid Funds vs Fd- Why Liquid Funds are Better Than Fixed Deposits?

We all understand the importance of debt in our portfolios since it offers security, stability, and consistent income. It goes without saying that you cannot invest all of your funds in stocks since the danger in the case of a downturn would be simply too great. But that’s where the trouble really begins.

Bonds, debentures, government securities, bank FDs, corporate FDs, mutual funds, liquid funds, etc. are just a few of the many debt instruments you can choose from.

It can be hard to decide where to invest. While some suggest that fixed deposits are the ideal option, others favour investing in liquid mutual funds. You must choose where to invest now: in liquid funds or in fixed-income securities (FDs)?

Where do fixed deposits and liquid funds fit in??

FDs in the bank and liquid funds are not wealth generators, so keep that in mind from the beginning. You can put all of your money into money market accounts or liquid funds over the course of your life and still not have much left over. Equities play a role in wealth building, but we won’t discuss that now.

if you need to retain your money in a secure location for other obligations or for unforeseen demands. Not wealth creation, but rather principal safety and modest returns, is your major goal in this situation.

The funds must be readily accessible without a financial loss and sufficiently liquid. Capital needs to be protected more than anything else.

Despite mutual funds becoming increasingly popular, fixed deposits and recurring deposits were the only types of investments available in India for a very long time. This is mostly due to the fact that these investments are the most dependable and they guarantee principal repayment without being subject to market changes.

Due to government support and deposit insurance, people have faith in banks. Even while FDs and RDs promise returns, liquid funds can assist keep your money liquid while offering a marginally greater income.

So what are FDs and what are liquid funds?

Before choosing which of the two is better, let’s first thoroughly comprehend liquid funds and fixed-income securities. Here is a short summary of both goods.

For many people around the world, it is the most popular investment option. The Reserve Bank of India said that the share of FD accounts was approximately 58.2%.

Liquid mutual funds, on the other hand, are debt funds made up of treasury bills, commercial papers, certificates of deposit, etc. Despite the fact that liquid funds include some market risk, it is still a fairly safe investment.

It often makes investments in financial instruments with a short maturity period—less than 91 days. Despite the benefits they offer, bank FDs continue to have a very strong market or clientele since they are the foundation of every customer’s connection with the bank.

How do liquid funds and bank FDs compare on the risk parameter?

Because they are risk-free, fixed deposits have been a staple of the financial industry for a very long time. Additionally, the fact that the principal is guaranteed by the government makes it more appealing to many clients.

Liquid funds, on the other hand, carry a modest risk since their performance is influenced by market risks, shifting interest rates, etc. The market risk still exists even if liquid funds are less susceptible to changes in interest rates than G-Sec funds.

In addition to the risk issue, you should be aware that the NAV of liquid funds may experience challenges, as we witnessed in the case of Templeton in 2020.

How do liquid funds and bank FDs compare on the returns parameter?

A little higher rate is offered to senior citizens. A fixed interest rate will be used to grow your money over the course of the loan. Therefore, if you want the biggest profits, it is not the greatest option.

Profits are produced by liquid funds at interest yields of 5% to 6%. However, whenever rates increase in the market, liquid funds are probably going to provide better rates.

The advantage of liquid funds over bank FDs in terms of return is between 100 and 150 basis points.

How do liquid funds and bank FDs compare on the time horizon?

Depending on your preferences, you can choose the investment duration, and the minimum deposit should be Rs. 1000. The interest rates on a 7-day FD, however, are only 2.8% annualised.

Up to 91 days are the maximum maturity time for liquid funds. You can begin investing with as little as Rs. 1000 or as much as Rs. 5,000 each month. It is far more adaptable in terms of time horizon because it may be used to a variety of time frames.

How do liquid funds and bank fds compare on the taxation?

Bank FDs are eligible for tax deductions under Section 80C of the Income Tax Act, although a five-year lock-in is required. The interest component, however, is taxed at your top rate. Therefore, the 5% yield on an FD would actually be 3.5% after taxes if you are in the 30% tax band.

You must first keep in mind that liquid funds are classified as debt funds when discussing tax on them. If you choose a dividend plan, your dividend will be taxed at your top rate, just like an FD. Gains made in the short term—less than a year—are taxed at the highest rate.

However, if kept for longer than three years, it is taxed at a reduced rate of 20% with benefits for indexation, which further lowers the tax liability.
Stock Market Whatsapp groups

Friends, welcome! Thanks for visiting my website, WhatsappGroupJoinsLink. The most recent and current WhatsApp Groups are now available in our WhatsApp Group Joins Link. All different kinds of WhatsApp group links can be found here.

You’ve found the proper location if you’re looking for links to Indian Stock Market WhatsApp Groups. On this page, you may find groups for the Active Indian Stock Market of various varieties.

Indian Stock Market Whatsapp Group Links Rules

  • There is only the Indian Stock Exchange allowed.
  • Always treat people with respect.
  • Do not alter the group’s name or icon without admin consent.
  • No member of the group should be abused.
  • Links from spam are prohibited.
  • Any Whatsapp user can join these groups.
  • Posting personal information in these communities is not permitted.

Indian Stock Market WhatsApp Group Links to Join

  • Stock market – Join
  • Anmol Stocks 2 – Join
  • STOCK DISCUSSION ADDA – Join
  • Kucoin trader and signals – Join
  • Big Bull Traders 2 – Join
  • Master Trader – Join
  • ARNING WITH TRADER –  IND – Join
  • OLYMP TRADE Signals – Join
  • Future Trader  – Join
  • Big Bull Traders 1 – Join
  • Free Share market Classe – Join
  • Raaza the forex – Join 
  • Stock market – Join 
  • PROFIT DYNAMIC – Join 
  • stockmarket trading –Join 
  • Stock Market – Join 
  • Security deposits  – Join 
  • Secret Trading – Join 
  • Nc trading/options – Join 
  • India FVP Trade  – Join 

Stock Market WhatsApp Group

  • ONLY BANK-NIFTY Group: JOIN
  • Options Trading: JOIN
  • Share Market Group: JOIN
  • Risk Taker Investors: JOIN
  • Secret Trading Club: JOIN
  • Share Market Update: JOIN
  • Stock Adda Wh group: JOIN
  • Stock market tips: JOIN
  • Join Stock Market Group: JOIN
  • Learn Stock market: JOIN
  • Stock Market Tips: JOIN
  • Stock Market Wh Group: JOIN
  • STOCK ROLLERS: JOIN
  • Stock Trading Group: JOIN
  • Stock Market Information: JOIN
  • Stockist Group: JOIN
  • Stockist Group 2: JOIN
  • Stock Market Trading: JOIN
  • The Stocks Bull: JOIN
  • Trade warriors: JOIN
  • Trade warriors 2: JOIN
  • Join Traders Club: JOIN
  • Traders Club 2: JOIN
  • Trading for beginners: JOIN
  • Trading Godfather: JOIN
  • Trading passion: JOIN
  • Trend maker investment: JOIN
  • Trend maker investment 2: JOIN

Stock Market Learning WhatsApp Group

More Stock Market Whatsapp Groups are coming soon……….