The National Stock Exchange of India’s (NSE) Nifty 50 index is a significant benchmark index, and a number of factors affect its movements. The following are some of the primary variables that may have an impact on Nifty 50 index trading:
Economic Data: The Nifty 50 index can be significantly impacted by economic indicators including GDP growth, inflation rates, industrial production, and employment data. Positive economic data frequently fuels market optimism and could raise the score.
Corporate Earnings: An important consideration is the Nifty 50 firms’ financial performance. Positive index effects might result from strong corporate earnings releases since they can boost investor confidence and stock prices.
Interest Rates: The Reserve Bank of India’s (RBI) monetary policy choices, such as adjustments to interest rates, can have an impact on the cost of borrowing and investment choices. Stock prices may decrease in response to interest rate increases, while stock prices may increase in response to interest rate decreases.
Inflation: Inflation reduces consumer purchasing power and may have an effect on business profitability. Concerns about cost increases brought on by high inflation rates could have a detrimental impact on the Nifty 50 index.
Institutional Investors: from Outside India: Institutional investors from outside India (FIIs) are a major player in the Indian equities markets. Their purchasing or selling actions may significantly affect the Nifty 50 index.
Global Market patterns: The Nifty 50 index can be affected by factors such as investor sentiment, geopolitical events, and patterns in major global stock markets.
Currency exchange rates: Changes in exchange rates may have an impact on Indian exports and imports, which may have an impact on business revenues and profitability and ultimately have an impact on the Nifty 50 index.
Government Policies: The Indian government’s policy choices and changes may have a direct or indirect impact on a number of sectors and industries, including those that make up the Nifty 50.
Market Sentiment: The Nifty 50 index may briefly fluctuate depending on investor and market psychology. Bullish sentiment and good news typically push prices up, while bad news might push prices lower.
Global Commodity Prices: Particularly in industries like energy, manufacturing, and metals, the expenses and profitability of businesses can be impacted by changes in the price of important commodities like oil and metals.
Corporate Events: The index may be impacted by corporate events such as mergers and acquisitions, stock splits, dividend declarations, and changes in management of Nifty 50 businesses.
Technical Analysis: Chart patterns, trading activity, and moving averages can all have an impact on short-term trading decisions and contribute to changes in the price of the Nifty 50 index.
Market conditions and liquidity: can affect trading in the Nifty 50 index, particularly during times of extreme volatility. Market liquidity includes the number of buyers and sellers.
It’s important to note that the Nifty 50 index is a representation of the broader Indian stock market and is composed of 50 large-cap stocks from various sectors. As such, it is influenced by a combination of domestic and international factors, making it a complex and dynamic index to analyze and trade. Traders and investors often use a combination of fundamental and technical analysis to make informed decisions in the Indian equity markets.
In order to attain specified objectives, control risks, and maximise profits, stock option planning and strategies involve the use of stock options as part of a person’s or a business’s financial planning. The right to buy (call option) or sell (put option) a defined number of shares of stock at a fixed price (strike price) within a predetermined period of time (expiration date) is provided by stock options, but not the duty to do so. Here are some planning and strategy examples for common stock options:
ESOs, or employee stock options:
Employers provide stock options to employees as a form of pay through employee stock option plans (ESOPs). ESOPs can be utilised to recruit and keep top personnel while coordinating employee goals with business success.
Vesting Schedules for Stock Options: Businesses frequently impose vesting schedules, requiring workers to work for the company for a predetermined amount of time before they can exercise their options. This encourages worker loyalty.
Employees have the option of exercising their stock options and keeping the shares, which could result in long-term stock price growth.
Employees may exercise their options and sell the shares right away in order to make a profit. Employees can manage risk and gain from this tactic.
Strategies for Investor Stock Options:
With covered call writing, stockholders can sell call options on their holdings and profit from the premium they receive. The option expires worthless and the investor keeps the premium if the stock price stays below the strike price.
Put options can be bought by investors to shield their stock holdings from potential downward risk. The put option can reduce losses if the stock’s price decreases.
Buy call and put options with the same expiration date but different strike prices as part of the straddle and strangle strategies. They are employed when investors expect high levels of price volatility but are unsure of the movement’s direction.
Spreads that profit from either bullish (call spreads) or bearish (put spreads) market movements can be made using options. With these tactics, options with various strike prices and/or expiration dates are bought and sold.
Tax Preparation:
Exercise at a Tax-Effective Time: The timing of stock option exercise might have tax repercussions. It can be smart to schedule your exercise when your tax liability is smaller.
The tax treatment of various stock option types, such as Incentive Stock Options (ISOs) and Non-Qualified Stock Options (NSOs), varies. Planning for taxes requires an understanding of these distinctions.
Risk Administration:
Hedging Techniques: Using options, investors can protect their current stock positions from unfavourable price changes. For instance, purchasing put options might shield you from future losses.
Leverage and Speculation:
Trading Options: Traders can utilise options for speculative purposes by placing bets based on predictions of future changes in stock price. Leverage is a feature of options that enables traders to take control of a greater position with a lower outlay.
Earnings Generation:
Selling Cash-Secured Puts: Investors may sell put options with the goal of acquiring the underlying shares at a reduced price in the event that the option is executed. This tactic creates income and may result in the purchase of stocks at a discount.
Estate Management:
Giving Stock Options: Giving stock options to family members is one estate planning strategy that can be used to transfer wealth while minimising tax responsibilities.
Stock options can be complicated financial tools, therefore their use should be carefully assessed in light of a person’s financial objectives, level of risk tolerance, and tax situation. When adopting stock option planning and tactics, it is frequently advisable to speak with a financial counsellor or tax expert. Additionally, depending on the market environment and a person’s unique situation, other techniques may be used.
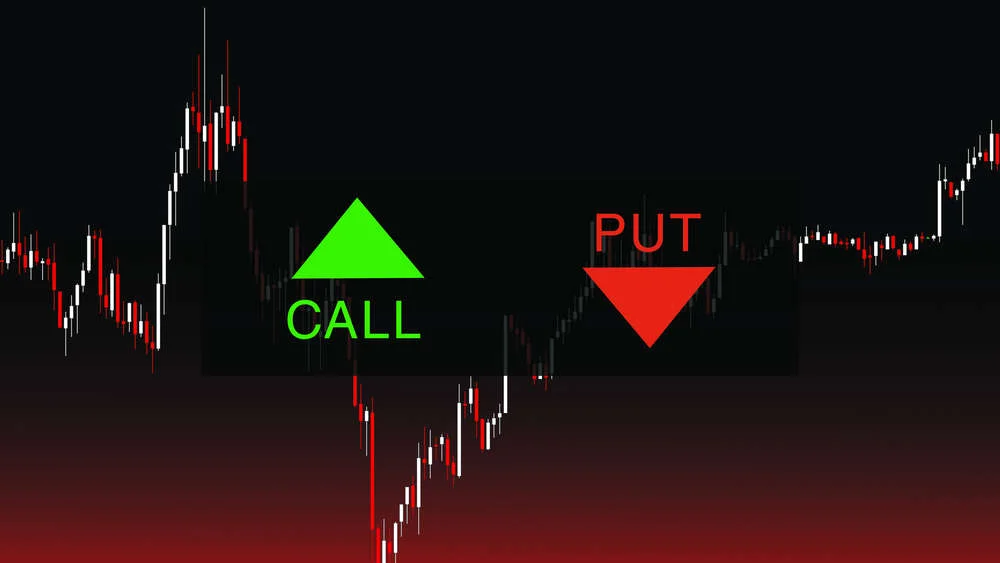
“Put-Call Ratio” is what PCR stands for when referring to intraday trading. It is a well-liked technical indicator that investors and traders use, particularly in the options market, to evaluate market mood and probable future price moves. By comparing the total number of put options traded against the total number of call options traded on a particular underlying asset, such as a stock or an index, the put-call ratio is determined.
PCR (Put-Call Ratio)
The Put-Call Ratio in daily intraday trading operates as follows:
1.How to Determine the Put-Call Ratio: Typically, one of two methods is used to determine the put-call ratio:
Volume-based PCR: In this technique, the overall trading volume of call options is contrasted with the total trading volume of put options. The volume-based PCR would be 0.5 (1,000/2,000) if 1,000 put options and 2,000 call options were traded as an example.
Open Interest-based PCR: This technique makes use of the total open interest, or the amount of active put and call option contracts. The open interest-based PCR for 5,000 open put contracts and 10,000 open call contracts would be 0.5 (5,000/10,000).
2. Understanding PCR Results:
PCR 1: A PCR below 1 shows that there are more open call contracts or traded call options than there are put options. As traders are more likely to purchase call options in expectation of price increases, this may indicate a bullish sentiment.
PCR > 1: A PCR above 1 suggests that there are more open put contracts than there are traded put options. Given that traders are buying put options as protection against probable price falls, this may indicate a negative sentiment.
PCR = 1: A PCR of 1 indicates a balanced market mood, with the quantity of call and put options traded being equal.
3. Intraday Trading using PCR:
The Put-Call Ratio is frequently used by intraday traders as a contrarian indicator. A market may be overbought if the PCR is exceedingly low (showing extreme bullishness), in which case a correction may be just around the corner. On the other hand, a very high PCR (signalling extreme bearishness) can indicate an oversold market, in which case a rebound might be anticipated.
The Put-Call Ratio is a trading tool used to confirm other technical or fundamental indications. For instance, the bearish case for a stock may be strengthened if it exhibits technical negative patterns and has a high PCR.
Risk management: PCR can also be used by intraday traders to control risk. Traders may modify their holdings or employ protective measures like purchasing put options or tightening stop-loss levels in response to a rising PCR, which might indicate an increase in negative sentiment.
Timing considerations made by intraday traders may take PCR into account. For instance, a trader would seek for opportunities to enter short positions for a potential reversal if the PCR is unusually low and the market is exhibiting symptoms of fatigue in an upswing.
It’s crucial to remember that even though the Put-Call Ratio might offer insightful information on market sentiment, it shouldn’t be used in isolation. In order to make informed intraday trading decisions, traders often utilise it in conjunction with other technical and fundamental indicators. Additionally, PCR values may be interpreted differently based on the particular market circumstances and the underlying item being traded.
Numerous variables can affect the exchange rates between different currencies in the foreign exchange (forex or FX) market. Macroeconomic and geopolitical factors can be broadly categorised into two primary groups.
Foreign Exchange Market
Interest rates: are determined by central banks and have an impact on how appealing a currency is. Higher interest rates frequently draw foreign investment, which raises demand for the currency and may support its value.
Economic Indicators: A number of economic indicators, including GDP growth, employment data, inflation rates, and manufacturing data, can have an impact on currency values and market mood. A stronger currency is frequently a result of excellent economic performance.
Political Stability: The general economic and political climate of a nation can have an impact on investor confidence. Stronger currencies are typically seen in nations with stable governments and economy.
Trading and investing speculation:can cause short-term swings in exchange rates since traders and investors frequently make predictions about currency movements.
Central bank interventions: To affect exchange rates, central banks can buy or sell their own currency on the forex market. The value of currencies may be significantly affected by these measures.
Market Attitude: In the foreign exchange markets, trader attitude and market psychology are quite important. Exchange rates can vary quickly as a result of news, events, and rumours.
Trade Balance: A nation’s currency may be affected by its trade balance, which is the difference between its exports and imports. A currency can be strengthened by a trade surplus (more exports than imports), but a currency can be weakened by a trade deficit.
Geopolitical Events: Political occurrences like elections, wars, and trade disputes can wreak havoc on currency values and cause uncertainty. For instance, the British Pound was significantly impacted by Brexit.
Market Liquidity: Depending on the time of day and trading sessions, the forex market’s liquidity can change. Volatility may rise as a result of low liquidity.
Market Sentiment: Traders frequently respond in irrational ways to news, rumours, and events, causing sharp changes in sentiment and currency values.
Natural disasters: Natural disasters can affect a nation’s currency by upsetting its infrastructure and economy.
Monetary Policy: The monetary policy choices made by central banks, such as adjustments to interest rates or the implementation of quantitative easing plans, can directly affect the prices of currencies.
Global Economic Conditions: More general aspects of the global economy, such as the state of the financial markets and the state of the world economy, can have an impact on currency fluctuations.
It’s crucial to remember that options activity can also be impacted by particular news items, events, and market mood, which could result in brief increases in trading volume for certain companies or industries. Before investing in the options market in any industry, traders and investors should stay up to date on market movements and perform comprehensive research.
concall
Scheduled Event:Conference calls are frequently scheduled by businesses to take place at the same time as their quarterly or annual financial results are announced. These discussions, which go by the name of earnings conference calls, are intended to give investors, analysts, and the general public more details about the company’s performance and expectations.
Access Details: Businesses typically provide conference call access details, such as the date, time, dial-in number, access code, and occasionally a web link for a live webcast. The company’s website normally posts this information, and press releases or investor relations communications may also be used to share it.
Participants: The senior management team of the firm (such as the CEO and CFO), financial analysts, institutional investors, retail investors, and members of the media can all take part in a concall. The debate is open to participants, who may also pose questions sometimes.
Agenda: The company’s management frequently adhere to a predetermined agenda during the conference call. They might go over operational updates, financial results, and future guidance while also responding to analyst and investor queries.
The question and answer (Q&A): portion of a conference call is one of its most important components. Investors and analysts might inquire about the company’s operations, business plans, or any other pertinent subjects. Participants will have the chance to learn directly from the management of the organisation.
Recording: For individuals who couldn’t attend the live event, many businesses record their conference calls and post the recordings on their websites. This makes it possible for interested individuals to listen to the call later.
Concalls are crucial for openness and dialogue between businesses and their stakeholders. Companies can use them as a platform to share pertinent information, answer to questions, and explain their strategic and financial positions. Investors and analysts frequently pay close attention to these calls in order to gain information about a company’s performance and future prospects, which can affect stock market trading and investment choices.
How does it work in Stock Market?
Buying and selling stocks and the general mechanics of the stock market are referred to as “how it works” in the stock market. Here is a brief explanation of how the stock market operates:
1.Stock Exchanges:Stock exchanges are regulated markets where buyers and sellers come together to trade stocks. Stock exchanges are where the majority of stock trading takes place. The New York Stock Exchange (NYSE) and the NASDAQ in the United States, as well as the Bombay Stock Exchange (BSE) and the National Stock Exchange (NSE) in India, are a few well-known stock exchanges.
2.Listed Companies: The initial public offering (IPO) procedure is used by businesses to raise money by selling ownership holdings in the form of stocks. Stock of a corporation can be traded once it is admitted to an
exchange.
3.Participants in the market
Investors: Stock buyers and sellers, including private citizens, businesses, and traders.
Brokers: Agents that act as middlemen in stock transactions for the benefit of investors.
Market Makers: Organisations that regularly buy and sell stocks to keep the market liquid.
4.Order placement: Through their brokerage accounts, investors place orders to buy or sell equities. Market orders (done at the current market price) and limit orders (performed at a specific price or better) are two different types of orders.
5.Order matching:Buy and sell orders are matched by stock exchanges based on price and priority of execution. A trade happens and the ownership of the stock moves when a buy order and a sell order are in agreement.
6.Ask and Bid: The “ask” is the lowest price a seller is ready to accept while the “bid” is the maximum amount a buyer is willing to pay for a stock. The discrepancy between these two prices is known as the “bid-ask spread”.
7.Market Indices:Indexes that track the performance of a particular group of equities are frequently available on stock exchanges (e.g., S&P 500, Nifty 50). These indices act as the general market’s benchmarks.
8.Stock pricesare impacted by supply and demand dynamics when determining their price. Stock prices can rise when there is good news, great financial performance, and investor sentiment, while
prices can fall when there is bad news or poor performance.
9.Market Orders:Market orders are carried out instantly at the going rate of the market. Due to shifts in supply and demand, the price at which the order is fulfilled may differ somewhat from the last traded price.
10.Investorscan designate a price at which they are willing to buy or sell using limit orders. If the desired pricing is not obtained, these orders might not be carried out right away.
11.Trading Hours: Trading occurs during defined trading hours at stock exchanges. The exchanges and regions can have different hours.
12.Regulation: To promote fairness, transparency, and investor protection, stock markets are highly regulated. Regulatory agencies monitor market activity and uphold laws, such as the Securities and Exchange Commission (SEC) in the United States.
13.Market Data:Investors and the general public are provided with market data, such as stock prices, trading volume, and other information, in real-time. Investors can make wise selections with the use of this information.
The stock market is a complicated system that is impacted by a variety of factors, such as economic conditions, geopolitical developments, and investor emotions. A long-term investing strategy, research, analysis, and risk management are frequently necessary for successful stock market involvement. Additionally, there are hazards associated with stock investment, so before trading or purchasing stocks, individuals should think about their financial objectives and risk tolerance.
Advantages and Disadvantages
Advantagesof Investing in the Stock Market:
Potential for High Returns: Historically, compared to many other investing options, such as bonds or savings accounts, the stock market has offered higher average returns. Stocks have the potential to generate large gains over the long run.
Ownership in Successful Companies: When you purchase stocks, you acquire a portion of the ownership of the businesses you invest in. If the corporation provides income to shareholders, this ownership may include dividend rights and voting privileges.
Diversification: There are many different investment possibilities available on the stock market, spanning many different industries and areas. Spreading risk can be accomplished by diversifying your portfolio by purchasing a variety of equities.
Liquidity:Stocks are a relatively liquid asset, which means you can typically purchase and sell them fast, giving you access to your investing capital when you need it.
Professional Management:Professional fund managers make investing decisions on your behalf when you invest in mutual funds or exchange-traded funds (ETFs), possibly saving you time and effort.
Dividend income: A source of passive income for investors, some equities pay dividends on a regular basis.
Hedging Against Inflation: Over the long term, stocks have the ability to outperform inflation, preserving your purchasing power.
Disadvantages of Investing in the Stock Market:
Volatility:Stock values are subject to frequent value swings and high levels of volatility. This makes investing in stocks dangerous, especially for short-term investors, and can result in significant short-term losses.
Risk of Loss: If the firms you invest in perform poorly or go bankrupt, you run the risk of losing everything you invested in individual stocks.
Emotional Stress:Market upheavals and downturns can cause investors to feel emotionally stressed, which can cause them to make snap decisions that may not be in line with their long-term objectives.
Complexity: Stock investing necessitates market research and expertise. This complexity may serve as a deterrent for some people.
Time-consuming: Successful stock portfolio management requires careful attention to market news, thorough study, and well-considered decisions.
Transaction Costs:Transaction costs and brokerage commissions are frequently associated with buying and selling stocks, which can lower overall returns, particularly for frequent traders.
Lack of Diversification: A concentrated stock portfolio may be more susceptible to market downturns and industry-specific hazards if it is not sufficiently diversified.
No Guaranteed Returns:Stocks do not provide guaranteed returns, in contrast to other fixed-income investments. Even over long stretches of time, losses are always possible.
Conclusion
In conclusion, stock market investing has both opportunities and risks; your choice should be in line with your financial objectives, level of risk tolerance, and investment horizon.
The possibility for large profits, ownership in successful businesses, diversification possibilities, liquidity, expert management through funds, dividend income, and an inflation hedge are all benefits of stock investing.
The stock market’s volatility, the risk of financial loss, emotional stress, complexity, time commitment, transaction costs, the lack of diversification in concentrated portfolios, and the absence of guaranteed returns are all key drawbacks to take into account.
Successful stock market investing frequently calls for a long-term outlook, strict risk control, and a well-thought-out investment plan. To choose investments that are in line with your overall financial strategy, it is essential to perform your research, take into account your financial situation, and, if required, consult with financial experts. Keep in mind that no investment is completely risk-free, and your investment decisions should be based on your unique situation and objectives.
Swing trading involves catching short- to medium-term price changes by examining technical and fundamental variables. The following advice will make you a more effective swing trader:
Create a trading strategy:
Establish your objectives, risk tolerance, and trading plan.
Choose the stock or ETF categories that you want to trade.
Technical Evaluation:
To determine entry and exit positions, use technical indicators such as moving averages, RSI, MACD, and Bollinger Bands.
Analyse chart patterns like double tops and bottoms, flags, and head and shoulders.
Theoretical Analysis:
Keep up with news and happenings that may affect the stocks or ETFs you are trading.
Examine financial records, earnings reports, and other pertinent information.
Risk Administration:
Limit potential losses by placing stop-loss orders.
Never put more than a predetermined portion of your trading capital at danger in one transaction.
Size of Position:
Your risk tolerance and stop-loss thresholds should be used to determine the size of your investments.
Limit the use of leverage.
Exit and Entry Techniques:
A breakthrough from a chart pattern or a bounce from a support level are good entry signs to watch for.
Before making a trade, go out your exit strategy, including your profit targets.
Trend Recognition:
To enhance your chances of success, concentrate on trading in the general direction of the trend.
Utilise several timeframes to verify trends.
Trade Choice:
Stocks or ETFs with strong liquidity and low spreads should be given priority.
Steer clear of stocks with little trading activity.
Emotional control:
Maintain your trading strategy and abstain from rash choices.
Avoid letting fear or greed influence your trading decisions.
Continual Education:
Keep up with trading tactics and market movements.
Review all of your trades, both profitable and failed, to gain knowledge from your mistakes.
Paper Exchange:
Before risking actual money, test your techniques in a virtual trading environment.
Diversification:
Do not focus all of your resources in one industry or trade. Spread out your holdings.
Management of time:
Avoid overtrading and set aside designated hours for research and trading.
Adaptability:
Be adaptable and prepared to change your plan in response to shifting market conditions.
Keep records:
To keep track of your transactions, strategy, and performance, keep a trading notebook.
Stay Up to Date:
Watch for geopolitical developments, earnings releases, and economic calendars that could affect your trades.
Be persistent:
Since not every trade will be profitable, swing trading may call for patience. Await the ideal circumstances.
Employ limit orders:
To minimise the danger of slippage, think about placing limit orders to enter and exit trades at particular price points.
Think about volatility:
While offering additional trading opportunities, volatile stocks and ETFs also carry a larger risk.
Continue to learn about taxes:
Plan your trades taking into account the tax ramifications.
Keep in mind that there are inherent dangers in swing trading, and that it is not a surefire strategy to generate money. It’s essential to successfully manage these risks and to consistently improve your plans in light of your knowledge and the state of the industry.
Quantitative trading, often known as “quant trading,” is a type of trading technique that uses computer algorithms, data analysis, and mathematical and statistical models to make trading decisions. To find trading opportunities, control risk, and complete trades in the financial markets, quantitative traders utilise quantitative and data-driven strategies.
quant trading
Aspects of quantitative trading include the following:
Quantitative traders collect and examine a tremendous quantity of financial data, such as historical price and volume information, economic indicators, and mood in the news. To find patterns, correlations, and anomalies that can guide their trading tactics, they use this data.
Trading algorithms, which are formulas and procedures that specify when to purchase or sell specific financial products, are created and used by quantitative traders. These algorithms can be created to automatically place trades when certain criteria are satisfied.
Risk management: A key component of quantitative trading is risk management. By establishing stop-loss orders, position sizing, and portfolio diversification tactics, traders utilise mathematical models to evaluate and control risk.
Statistical Models: To predict future market movements and make wise trading decisions, quantitative traders frequently use statistical models, such as time series analysis, regression analysis, and machine learning techniques.
High-Frequency Trading (HFT): High-frequency trading, which some quantitative trading systems entail, refers to the extraordinarily quick execution of deals. HFT algorithms can carry out a huge number of trades per second, taking advantage of minute price differences in milliseconds.
Quantitative traders frequently believe that markets are at least somewhat efficient, which means that prices accurately reflect all available information. They try to take advantage of temporary inefficiencies or mispricings.
Backtesting: Traders frequently carry out extensive backtesting prior to using a quantitative trading strategy in live markets. In order to evaluate the strategy’s effectiveness and improve the algorithm, historical data must be applied.
Quantitative Research: Trading that is quantitative requires constant research and development. In order to react to shifting market conditions and maintain competitiveness, traders regularly improve their models and algorithms.
How does it work in Stock Market?
Making trading decisions with the use of mathematical models and algorithms is known as quantitative trading in the stock market. Here is a little explanation of how it operates:
Data Gathering: Quantitative traders begin by gathering a variety of stock market-related data. This information consists of historical price and volume information for specific stocks and market indices, as well as information on economic indicators, business financials, news sentiment, and other pertinent variables.
Data analysis: To find patterns, correlations, and statistical linkages, the acquired data is examined. Quantitative analysts (quants) analyse market behaviour and stock price changes using a variety of statistical and mathematical methodologies.
Model Development:Quantitative analysts create models in mathematics to represent their trading tactics. These models can be in the shape of machine learning algorithms, time series models, or regression models. The objective is to develop a model that can forecast future changes in stock price or spot trading opportunities.
Backtesting: The model goes through extensive backtesting before being used in actual trading. Backtesting entails using historical data to run the model and mimic its performance in the past. This enables quants to assess the past performance of the strategy and make any necessary adjustments.
Risk management: Techniques for risk management are incorporated into quantitative traders’ methods. To disperse risk, they must do things like decide on position sizes, set stop-loss thresholds, and diversify their portfolios. To guard against severe losses, risk management is essential.
Execution of the algorithm: After the model has been created and put to the test, it is included into a trading algorithm. Based on the output of the model, this algorithm automatically creates buy or sell recommendations. The system can carry out trades in real-time, frequently with little assistance from humans.
Market Connectivity: Through electronic interfaces, quantitative trading systems are linked to stock exchanges and trading platforms. These systems provide speedy trade execution by enabling for the submission of orders and the receipt of real-time market data.
Monitoring and Modification: Quantitative traders regularly assess the real-time effectiveness of their methods. The algorithm or the model can be changed if the market conditions change or if the strategy performs poorly.
High-Frequency Trading (Optional): High-frequency trading (HFT) refers to certain quantitative trading strategies that entail extremely quick trade execution, frequently with holding times measured in milliseconds. HFT tactics need ultra-low latency technology in order to take advantage of minor price differences.
Compliance and Regulations: Quantitative trading companies are subject to legal requirements and trade regulations. To make sure they operate within the law, they frequently use risk controls and compliance procedures.
Advantages and Disadvantages
Advantages
Data-Driven Decision Making: Quantitative trading depends on statistical models and data analysis, which can result in more data-driven decisions that are less influenced by emotions.
Efficiency and Speed: Automated algorithms can execute transactions far more quickly than human traders, enabling quick responses to market fluctuations and the possibility to profit from transient opportunities, particularly in high-frequency trading.
Backtesting: Before implementing their techniques in live markets, quantitative traders can rigorously verify the performance of their previous strategies using historical data.
Risk management: Advanced risk management tactics, like as stop-loss orders and position size, are frequently incorporated into quantitative trading algorithms to help control and reduce losses.
Quantitative trading:makes it simple to diversify among a variety of companies, asset classes, or markets, which spreads risk and may improve portfolio stability.
Continuous Optimisation: is made possible by the ability of quantitative trading methods to be modified and enhanced over time in response to shifting market conditions.
Disadvantages
Complexity: The creation and upkeep of quantitative trading methods can be quite difficult and call for knowledge of math, statistics, programming, and finance. It may also require expensive infrastructure.
Backtesting is important, but it can result in overfitting, where a strategy does well on previous data but does poorly in actual markets because of its sensitivity to prior conditions.
Market Risk: Even carefully constructed quantitative techniques are susceptible to market risk. Significant losses might result from sudden and unexpected market occurrences, particularly if the models are unable to adjust.
Data Accuracy and Quality: When doing a quantitative analysis, high-quality data is essential. Incorrect trading decisions may result from data errors or inconsistencies.
Risks related to regulation and compliance: Quantitative trading is governed by regulations, and it is important to abide with them. Regulatory changes may make some tactics less viable.
Rivalry: As quantitative trading gains popularity, there is increased rivalry in this market, which makes it difficult to locate lucrative opportunities, particularly in highly liquid marketplaces.
Risks associated with technology: Because of their reliance on low-latency infrastructure and technology, quantitative traders are at risk for incidents like system outages, cyberattacks, and data breaches.
Lack of Intuition: Compared to human traders, quantitative trading algorithms may not have the same intuitive grasp of market dynamics. They could struggle to adjust to peculiar or novel market circumstances.
Conclusion
In conclusion, quantitative trading is a data-driven strategy that uses mathematical models and computers to trade financial products. It has certain advantages and drawbacks:
Advantages
Quantitative trading: lowers emotional biases in trading decisions by using data and statistical models to conduct an impartial examination.
Efficiency: Rapid execution made possible by automation enables quick responses to market changes and prospective business possibilities.
Risk management: To guard against substantial losses, quantitative tactics frequently include effective risk management procedures.
Backtesting: Thorough backtesting is a valuable tool for analysing and improving tactics, which raises expectations for their potential success.
Quantitative trading: makes it simple to diversify portfolios by distributing risk among several assets and markets.
Continuous Improvement: To react to shifting market conditions, strategies can be improved over time.
Disadvantages
Complexity: Creating and maintaining quantitative tactics can be extremely difficult and involve knowledge from many different fields.
Overfitting: Due to overfitting or sensitivity to historical conditions, strategies may perform well in backtesting but poorly in live markets.
Market Risk: Even well-designed strategies might suffer big losses as a result of sudden and unanticipated market occurrences.
Data Quality: Data accuracy and quality are crucial for analysis, and mistakes might result in poor trading decisions.
Regulatory and Compliance Risks: Adherence to regulations is necessary, and modifications to the law may have an impact on the effectiveness of a strategy.
Competition has increased due to the popularity of quantitative trading, making it harder to identify lucrative opportunities.
Risks associated with technology: Reliance on technology puts traders at risk for incidents like system outages, cyberattacks, and data breaches.
Lack of Intuition: Due to their lack of intuitive understanding, quantitative models may find it difficult to adjust to exceptional or unprecedented market conditions.
Deep knowledge of financial markets, complex modelling methods, and a dedication to ongoing research and adaptation are necessary for successful quantitative trading. In order to decide whether quantitative trading fits with their objectives and risk tolerance, traders should carefully assess the benefits and drawbacks. They should also be aware of the necessity for constant caution in a competitive and dynamic market.
Depending on the state of the market, the state of the economy, and investor attitude, certain sectors of the options market may be the most active. The following industries, however, typically rank among the most active in the options market historically:
Technology: Options markets are frequently very active for technology companies, particularly large-cap tech giants like Apple, Amazon, Microsoft, and Google parent Alphabet. These businesses are well-known for their price volatility, and options traders who want to profit from sudden price changes commonly trade them.
Financials: The options market is also quite active in the financial sector, which includes banks, insurance firms, and other financial institutions. Due to fluctuations in interest rates, economic indicators, and regulatory developments that may affect these companies, options on financial equities can be very popular.
Energy: The option markets for energy businesses, especially those engaged in oil and gas exploration, production, and services, are frequently active. Such variables as oil pricing, geopolitical developments, and supply-demand dynamics can have an impact on these choices.
Healthcare: The options market is active for healthcare stocks, particularly those of pharmaceutical and biotech firms. The options on these stocks can be considerably impacted by drug approvals, clinical trial outcomes, and regulatory decisions.
Consumer Discretionary: Businesses in this industry, which includes retailers, entertainment providers, and automakers, may also see significant levels of options trading. Product launches, earnings reports, and consumer buying trends can all influence the options market in this industry.
Utility stocks :are frequently traded in the options market because to their comparatively steady nature and dividend yields, despite not being as busy as some other sectors. Utility stock options can be utilised to generate revenue and minimise risk.
Healthcare: The options market is active for healthcare stocks, particularly those of pharmaceutical and biotech firms. The options on these stocks can be considerably impacted by drug approvals, clinical trial outcomes, and regulatory decisions.
Consumer Staples: Companies that make goods used in daily life, such as food, drinks, and household items, are also subject to options trading activity. These equities are sometimes thought of as defensive in character, which attracts options traders in volatile market situations.
Materials: Businesses in the materials industry, particularly those engaged in mining, metals, and chemicals, may encounter options activity influenced by elements such as fluctuating commodity prices, hiccups in the supply chain, and changes in the state of the economy.
Industrial: Options markets for industrial businesses, particularly those in the aerospace, defence, and manufacturing industries, can be active and impacted by governmental regulations, global commerce, and economic factors.
It’s crucial to remember that options activity can also be impacted by particular news items, events, and market mood, which could result in brief increases in trading volume for certain companies or industries. Before investing in the options market in any industry, traders and investors should stay up to date on market movements and perform comprehensive research.
A trader or investor’s wager on the direction of the price movement of an asset, such as a stock, commodity, or currency, is said to be “long” or “short” a position in the trading world. To comprehend how trading operates, it is important to understand these words. This is what they signify:
Long and short positions
Long Position:
Definition:Going long, also known as taking a long position, refers to purchasing an asset with the hope that its value will increase in the future.
Strategy: Long positions are taken by traders who anticipate that the asset’s value will rise over time, enabling them to sell it at a higher price later and benefit from the difference in price.
Profit and Loss: Gains and Losses: In a long position, gains are realised when you sell the asset for more money than you paid for it. However, you will suffer a loss if the asset’s value declines.
Risk: Assuming the asset’s price doesn’t fall to zero, the maximum loss in a long position is constrained to the amount invested. The possibility of making money is theoretically limitless.
Example:You have a long position if you purchase 100 shares of Company X at Rs.50 each. You will benefit if the price increases to Rs.60 per share and you decide to sell.
Short Position
Definition: Selling an asset that you do not own in the hopes that its price will fall constitutes taking a short position, also known as going short or short selling.
Strategy:In order to cover their initial sale and profit from the price difference, traders who take short positions try to repurchase the asset at a lower price in the future.
Profit and Loss: Gains and Losses: In a short position, gains are realised when you purchase back the asset for less money than you paid for it when you sold it in the first place. However, you will suffer a loss if the asset’s value increases.
Risk:Because there is no cap on how high an asset’s price can rise, the risk associated with a short position is essentially unbounded. The asset’s valuation at the time of shorting sets a limit on the profit that can be made.
Example: You could borrow 100 shares from a broker and sell them for Rs.100 each if you think the value of Company Y’s shares, which are presently selling at Rs.100 each, would drop. If the price later falls to Rs.80 per share, you can make a profit of Rs.20 per share by purchasing 100 shares at that price to replace the borrowed shares.
It’s important to note that short selling involves borrowing assets from a broker, which comes with its own costs and risks. Additionally, trading in either direction (long or short) should be done with careful consideration of market conditions, risk management, and your overall investment strategy.
How do they Work in Stock Market
Long and short positions function in the stock market as follows:
Long Position:
Purchase of Assets: When an investor purchases an asset, they do so at the market price for a predetermined number of shares or units.
Expected Price Growth: The investor anticipates that the asset’s price will increase over time, enabling them to sell it for a bigger sum.
Holding Period:The investor often keeps the item for a long time—weeks, months, or even years—before selling it.
Gains and Losses: If the asset’s price rises as anticipated, the investor can sell the asset for a profit. If they choose to sell, however, they can lose money if the price drops.
Risk management: To reduce possible losses, long-term investors frequently use risk management techniques including placing stop-loss orders.
Short Position
Asset Lending and Asset Sales: To take a short position, an investor borrows from a broker a certain number of shares or units of an asset and then sells them on the open market.
Expected Price Decline: The investor anticipates that the asset’s price will decline in the future.
Buy Back to Cover: In this strategy, the investor borrows an equal number of shares and later buys them back at a lower price than they originally paid in order to cover their short position.
Gains and Losses: In the event that the asset’s value declines as expected, the investor will profit from the price difference by repurchasing the item at a lower cost. They might experience a loss upon covering their short position, though, if the price increases.
Risk management: If the asset’s price drastically rises, short sellers run the risk of enduring limitless losses. They may employ stop-loss orders to reduce possible losses in order to minimise this risk.
Investors seek to profit from an asset’s price movement in both long and short positions. However, where they differ most is in how they anticipate the asset’s price to move. Short-term traders earn from decreasing prices, while long-term traders profit from rising prices.
It’s vital to remember that borrowing assets is a necessary component of short selling, and brokers frequently charge commissions or interest for executing short positions. The endless potential for losses if the asset’s price rises dramatically makes short selling more risky as well. When engaging in short selling or any other trading activity, investors should carefully examine their risk tolerance and use risk management techniques.
Advantages and Disadvantages
Advantagesof Long Positions:
Gain from Growth: Long positions profit from increasing asset prices, enabling investors to gain from the asset’s value appreciation.
Income Production: Some long holdings, such as bonds or stocks that pay dividends, can produce a consistent stream of income through interest or dividend distributions.
Less Risky: Compared to short selling, long positions are less risky because the greatest loss is constrained to the initial investment.
Ownership of the Investment: Long-term investors frequently have more ownership of their investments and are able to decide whether to buy or sell.
DisAdvantagesof Long Positions:
Limited Profitability: Long positions only generate income when the asset’s value rises. There is no chance to make money off such price declines.
Market downturns: Long positions may experience losses during bad markets or economic downturns, potentially depleting capital.
Opportunity Cost: Having a long position locks money into one particular investment, perhaps preventing you from taking advantage of other investment opportunities.
Advantages of Short Positions:
Gain from Decline: Trading short positions enables investors to gain from declining asset values, creating chances in bear markets.
Hedging: Short selling can be used to protect long positions from losses and reduce losses in a down market.
Diversification: By include assets that move in the opposite direction of the market, short positions help diversify a portfolio.
Flexible Trading:Trading with more flexibility is possible with short sales since investors can profit from both rising and declining markets.
DisAdvantages of Short Positions:
Unlimited potential: If the asset’s price drastically increases, requiring traders to repurchase it at a significantly higher price, short selling carries the potential of unlimited losses.
Borrowing Costs:Short sellers generally pay borrowing fees and interest on the assets they borrow, raising the cost of the transaction.
Challenges with Timing: In order to profit from declining prices, short sellers must precisely schedule their trades. Inaccurate timing might result in rapid loss accumulation.
Potential for Short Squeezes: A short squeeze can happen when numerous traders are shorting the same asset, which can cause a sharp price increase as short sellers rush to cover their holdings.
Limited Upside:Short positions offer a limited upside as the asset’s price can only decline to zero, but theoretically there is no downside risk.
Conclusion
In conclusion, long and short stock market positions each have unique benefits and drawbacks, making them appropriate for certain trading approaches and market conditions. Long positions are designed to profit from increasing asset values and offer chances for income production, but they come with the risk of losses during weak markets.
Conversely, short positions give traders the opportunity to profit from declining asset prices and offer hedging and diversification options. However, they come with the potential of illimitable losses, high borrowing rates, and timing issues if the asset’s value rapidly increases.
Your investment goals, risk tolerance, and market forecast should all be taken into consideration when deciding between long and short positions. Some investors combine both approaches to build a well-balanced portfolio and control risk. Whatever strategy you choose, it’s critical to undertake in-depth research, use risk management strategies, and keep up with market movements to make wise trading selections.
In India or any other market, choosing high-quality stocks for swing trading takes rigorous analysis and consideration of numerous criteria. To assist you find prospective swing trading candidates, consider the following general guidelines:
swing trading
Liquidity: Pay attention to stocks with active trading. Stocks with high trading volume typically have smaller bid-ask spreads and are less susceptible to price manipulation.
Price volatility: Seek out stocks with a track record of high price volatility. Stocks with frequent price swings are frequently better options for swing traders because they seek to profit from price volatility.
Trends: Determine which stocks are clearly trending. Capitalising on brief to medium-term price changes within an established trend is a common aspect of swing trading. You can spot trends using technical analysis tools like trendlines and moving averages.
News and Catalysts:Be mindful of future newsworthy events, earnings releases, and other catalysts that can affect the price of the company. Price responses to news are frequently used by swing traders.
Key Support and Resistance Levels: Pay close attention to these levels. You can use these to assist you decide where to enter and exit your swing trades.
Volatility Indicators: To assess a stock’s volatility and overbought/oversold circumstances, use technical indicators like the Relative Strength Index (RSI) and Bollinger Bands.
Sector Analysis: Take into account the general health of the industry that the stock is a part of. Swing trading chances may be better in strong sectors.
Risk Management:Implement sound risk-management strategies, such as placing stop-loss orders and only putting a tiny portion of your trading capital at risk in any given trade.
Diversification: Refrain from investing all of your money in one stock. Spread risk by distributing your trades among a variety of stocks.
Screening Tools: Use software and stock screening tools to find possible swing trading candidates that meet your criteria.
Please be aware that swing trading carries a certain amount of risk, therefore it’s crucial to have a clear trading strategy, discipline, and risk management in place. Furthermore, prior results are not necessarily predictive of future outcomes, therefore it is essential to consistently analyse and modify your trading techniques as market conditions shift. It is strongly advised that you get the advice of a financial expert or do extensive study before making any trading decisions.