Learning sharks-Share Market Institute


Rajouri Garden  8595071711 7982037049  Noida 8920210950 , and  Paschim Vihar  7827445731  

Fee revision notice effective 1st April 2025; No change for students enrolled before 15th May 2025

Download “Key features of Budget 2024-2025here

What is IEX Share Price?

IEX is powered by state-of-the-art, intuitive and customer centric technology, enabling efficient price discovery and facilitating the ease of power procurement.
IEX Share Price

The Central Electricity Regulatory Commission (CERC) oversees the Indian Energy market (IEX), an electronic power trading market established in India.

India’s leading energy market, Indian Energy Exchange, offers a national automated trading platform for the physical delivery of power, renewable energy, and certificates. In an effort to develop a fully integrated South Asian Power Market, IEX has more recently led the way in cross-border electricity exchange. Modern, user-friendly, and customer-focused technology powers IEX, enabling effective price discovery and enhancing the simplicity of power purchase.

With 7,300+ participants spread across 29 States and 5 Union Territories, including 1,800+ RE generators and obligated entities, 600+ conventional generators, and 55+ distribution utilities, IEX has a strong ecosystem. Additionally, it has a sizable network of 4600+ commercial and industrial clients, including those from the metal, food-processing, textile, cement, ceramic, chemical, automotive, information technology, institutional, residential, and commercial real estate sectors.

IEX has been in operation since June 27, 2008, and the Central Electricity Regulatory Commission has approved and regulated it. As of October 2017, IEX is a publicly traded corporation with the NSE and BSE.

Since August 2016, The Exchange has been accredited by ISO for quality management, information security management, and environmental management.

Who is the Director of IEX?

Rajeev Gupta holds a BTech from IIT BHU and an MBA from IIMA. He has 39 years of work experience, including 29 years in the financial services industry and 10 years in senior management positions in industrial firms.

With operations in M&A investment banking and private equity buyouts, Mr. Gupta formed Arpwood Financial Group in 2012. He formerly held positions as joint managing director of DSP Merrill Lynch (from 1995 to 2005), partner of the Carlyle Group, and head of India buyouts. Mr. Rajeev Gupta had held executive positions in industrial industries before joining DSP Merrill Lynch.

Mr. Gupta serves on the boards of United Spirits Ltd., EIH Ltd., T.V. Today Network Ltd., Vardhman Special Steels Ltd., Rane Holdings Ltd., TVS Capital Funds Ltd., and SBFC Ltd. as an independent non-executive member. He is a member of Bain & Co. India Ltd.’s advisory board.On April 27, 2022, he became a new Independent Director for our company.

How Does Trading Work On the IEX?

For instance, Bangalore is experiencing a power crisis, which would push up electricity prices and reduce the electricity board’s revenues. The electricity board will then use IEX to see whether there is a lower-priced electricity board, transmission firm, or renewable energy provider. After then, that segment will be put up for auction. Bangalore’s electrical board will be able to buy electricity more cheaply in this method. In addition, the organisation that sold the electricity will be able to turn a profit.

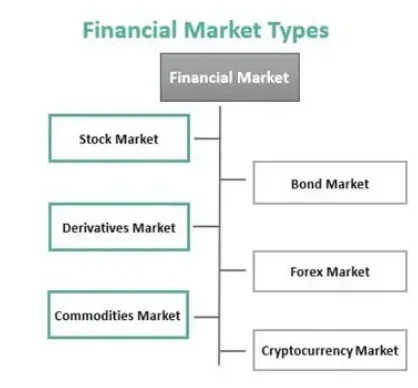
The IEX trades its products on a standard demand-supply basis. The IEX trades four main commodities:

  • One megawatt-hour (MWh) of electricity produced by a renewable energy source is certified as the bearer’s property by a renewable energy certificate (REC). Companies must comply with standards to demonstrate that they do not pollute and are following environmental regulations. A REC aids them in achieving this compliance, which may lead to government incentives, profits, or reduced taxes in the future.
  • Energy Saving Certificates (ESCerts) – Similar to RECs, Energy Saving Certificates (ESCerts) only show the amount of energy saved from a project in megawatt-hours (MWh). Like regular certificates, these certificates can be purchased and sold.Companies can buy and sell EScerts and RECs on the exchange. This implies that a corporation receives a clean bill of health even if it may be polluting heavily but yet purchases enough of these certifications.
  • the Day-Ahead-Market (DAM) It is a physical electricity trading market where electricity is distributed starting at midnight the following day and continuing for 24 hours. They trade in 15-minute increments of time. The auction bidding procedure was ended by the pricing and quantity of electricity.
  • The Term-Ahead Market (TAM) offers a variety of products that enable users to buy or sell power on a term basis up to 11 days in advance.

Can I Trade on the IEX?

Retail traders are not permitted on IEX. Electricity is physically delivered as part of the exchanges. A person is allowed to trade on the exchange if they are the owner of a business that uses a lot of power. In addition, the person needs the required approval from the CERC in order to be able to trade on the platform. A member or client must have at least Rs. 150 Lakhs in capital, per the exchange’s rules, in order to transact on the platform.

Why Indian Energy Exchange shares fell 15% . Explained?

In Friday’s trading, Indian Energy Exchange (IEX) shares fell as much as 15% to hit a 52-week low of Rs 116 on the NSE as some analysts took notice of a June 2 circular that stated that the Power Ministry had instructed the Central Electricity Regulatory Commission (CERC) to start the process of consultation and implement market coupling as soon as possible. The stock was down 9.93 percent at Rs 122.90 at 11:56 a.m.

IEX shares have dropped about 23 percent in two days after falling more than 8 percent in yesterday’s (June 8) final 30 minutes of trading. The IEX stock has lost 28 percent of its value over the past year, lagging the Nifty50 index, which has returned 13 percent over the same time frame.In the most recent development, price discovery would be handled by a super exchange, most likely a government organisation, leaving the power exchanges as nothing more than a platform for bid aggregation.

Market coupling will essentially kill innovation and competition in the sector, according to SN Goel, Chairman & MD of IEX. So, in my opinion, the interpretation of the market coupling that has been circulating for the past day is incorrect.

In any case, the ministry has asked CERC to check into this, according to Goel. “CERC will examine whether market coupling has a place in the current market design, which is a voluntary market, in this voluntary market design, whether we should pursue it or not, and what are the benefits,” he stated.

As of right now, IEX is India’s most reliable platform for determining power spot prices, which serves as a competitive advantage. The implementation of a full-fledged market coupler, however, entails that a neutral third party will compile all buy or sell bids and determine a standard market price for all exchanges.

This might make IEX’s “moat” ineffective because competing exchanges could eventually overtake it in terms of market share. The Day-Ahead Market (DAM) and Real-Time-Market (RTM) segments, which account for 75–80% of the exchange volumes, are almost entirely dominated by IEX.

What is market coupling?

PXIL explains market coupling as “the market coupler aggregates and matches all buy and sell orders from all the power exchanges to discover a uniform market clearing price, across all exchanges regardless of platform.”

The commercial moat of IEX is that it is now the most reputable platform in India for pricing determination. However, the MoP has instructed CERC to start the market coupling procedure.

For a relatively tiny fraction of the recently formed auxiliary market from April 23 to 29, NLDC served as the market coupler; yet, this marked the start of NLDC transitioning into a full-fledged market coupler function.

FOLLOW OUR WEBSITE: https://learningsharks.in/

FOLLOW OUR PAGE: https://www.instagram.com/learningsharks/

What are Financial Market in Stock Market?

Financial markets facilitate the interaction between those who need capital with those who have capital to invest.
Financial Market

The marketplaces where financial assets are bought and traded are referred to as “financial markets.” The term “financial assets” refers to things like stocks and bonds. The financial markets, broadly speaking, comprise a number of smaller marketplaces, including the stock market, bond market, forex market, commodities market, and derivatives market.

While some financial markets may be unregulated, others may be. And just like in any market, there are a variety of factors that affect the pricing of the financial assets traded there.

A business setting where various bonds and securities are traded at lower transaction rates is referred to as a financial market. It consists of several types of financial instruments, such as bonds, stocks, derivatives, and foreign exchange markets, to name a few.

The financial market is essential for a capitalist economy to run smoothly since it aids in resource allocation and provides liquidity for businesses.

The financial market makes sure that the right allocation of cash is made between investing and collecting parties.

KEY TAKEAWAYS

  • The marketplace where various financial assets, including bonds, shares, commodities, currencies, and derivatives, are traded is known as the financial market.
  • In order to transact in their desired financial assets at a defined price, it brings together the sellers and purchasers.
  • Depending on the state of the economy, millions of dollars are traded every day on the capital market through OTC or stock exchanges.
  • Some of the several categories of the financial market include stocks, bonds, derivatives, currencies, commodities, and cryptocurrency markets.

How Do Financial Markets Work?

A financial market is a venue where companies and investors hope to raise money to expand their operations and see a positive return on their investments. In this market, the buyers find the right vendors, and the sellers score a win by attracting the most qualified customers for their financial products.

Based on a variety of criteria, these marketplaces are divided into many categories. The primary classifications, however, are determined by the type of claim, the maturity of the claim, the delivery schedule, and the organisational structure.

For instance, a financial market is categorised as either a debt market or an equity market depending on the form and type of claim. Investors exchange bonds and debentures in the former, but they deal with stocks and other securities in the latter.

There is a money market that deals with money-backed securities and short-term funds like treasury bills, commercial paper, and certificate of deposit (CDs), depending on the maturity length. These investments expire after a year. The capital market is another one; it creates a platform for investors looking to purchase medium- and long-term assets.

Types of Financial Markets

6 types of financial market
Types of Financial Market
  • Stock Market

For businesses trying to raise finance, this is the centre. They first register their shares and then sell them in an initial public offering (IPO) on the secondary market to interested investors. They list the shares or stocks on stock exchanges, such as the NASDAQ, the NYSE, or OTC, a virtual trading floor.

  • Bond Market

It is the market, which enables investors to purchase bonds from businesses to fund their projects. The bonds are a pledge to pay back the businesses or the government who buys them within a predetermined time frame. For a full settlement, the corporations are required to pay the principal sum and interest.Corporations, as well as cities, states, and other sovereign entities, issue bonds to fund operations and projects. Securities like notes and bills issued by the US Treasury, for instance, are sold on the bond market. The debt, credit, or fixed-income markets are other names for the bond market.

  • Derivatives Market

Derivatives, which derive their value from an underlying asset, are traded on the derivatives market. Here, futures, options, forward contracts, and swaps can be traded by both individuals and businesses. To manage the financial risk, such deals can be entered either over-the-counter or in exchange-traded derivatives.The value of derivatives, which are secondary securities, is wholly based on the value of the primary security to which they are tied. A derivative has no value by itself. A derivatives market trades complex financial products like futures and options contracts, which derive their value from underlying securities like bonds, commodities, currencies, interest rates, market indices, and stocks, as opposed to trading equities directly.

  • Forex Market

Currency exchange is facilitated by the foreign exchange (Forex) market. These markets, which are run by financial firms, are used to calculate the exchange rates for all currencies.The forex market is decentralised and made up of a global network of computers and brokers from all over the world, just as the OTC markets. Banks, commercial enterprises, central banks, asset management businesses, hedge funds, as well as small-scale currency dealers and investors, make up the forex market.

  • Commodities Market

A commodity market deals with items like gold, oil, wheat, rice, and other commodities. There are over 50 significant commodity markets worldwide.However, the majority of these commodities’ trading occurs on derivatives markets, which use spot commodities as the underlying assets. Commodity forwards, futures, and options are traded over-the-counter (OTC).

  • Cryptocurrency Market

.Given the opportunities provided to investors and traders, digital assets are in demand. Blockchain technology is utilised for the transactions and their recording. The digital currencies, such as Bitcoin, Ethereum, and others, are accessible on internet crypto exchanges, enabling traders to engage in trade on a worldwide scale.

Users can swap digital currencies, including conventional currencies, using the exchanges’ digital wallets. And These platforms are likely to experience cyber problems like hacks and frauds because they are centralised markets.

Functions of Financial Markets

  • They enable the mobilisation of money:When you set aside a percentage of your salary, it just sits there until you decide to do something with it. However, financial markets give you a way to invest, which enables you to mobilise your savings. Thus, financial markets assist in bridging the gap between those who have the needed capital and those who do not.Additionally, they assist in re-directing stagnant money into the economy so that it can be productively used rather than just sitting about. After all, a country’s economy can only flourish if there is enough money in circulation.
  • They help determine the price of assets:The price of items increases as demand outpaces supply. And the price decreases when there is a surplus of supply compared to demand. That is how supply and demand affect how much anything costs. And the financial markets also follow this rule.Demand and supply are undoubtedly two of the most significant variables at play, continuously and reliably guiding world economic systems. Without either supply or demand, an economy cannot function in balance. These two forces also contribute to determining the price of the traded financial assets because they are the only two things that drive the financial markets. Without these markets, it would be practically impossible to correctly assess the pricing of financial assets because they would be unregulated.
  • They ensure liquidity of the assets:In essence, liquidity is a number that assesses how easily an item may be bought, traded, or turned into cash. Let’s further deconstruct it using a comparison illustration.Given its swift saleability and ability to be transformed into cash, gold is regarded as a highly liquid kind of investment. That is as a result of the high levels of yellow metal demand. In contrast, because real estate cannot be immediately sold off, it is often thought to be far less liquid.Financial markets serve as fair marketplaces for the selling and acquisition of assets. They also make certain that these financial assets are liquid by making it easy for you to buy and sell the aforementioned assets. In other words, you don’t have to look very far in these markets to find a buyer or a seller.
  • They help save time and money:Building on the concept of liquidity and taking into account the ease with which a buyer or a seller can be found, financial markets significantly reduce the amount of time required by all parties. Not only that. Additionally, they help you avoid wasting a lot of time and energy searching for potential buyers or sellers.The prices and fees connected with each transaction have also greatly decreased as a result of the financial markets’ entire transition to electronic trading. You can then save a tonne of money as a result of this.

Advantages and Disadvantages of Financial Markets

Advantages

  • Businesses can use it as a platform to raise money for both long- and short-term investments.
  • Companies might be able to finance themselves for less money than they would pay for a high-interest loan from a commercial bank. Furthermore, big loans are not offered by commercial banks.
  • Companies are able to borrow money whenever they need to, up until the point where their authorised share capital is exhausted.
  • Intermediaries in the financial sector, such banks and financial institutions, advise businesses and investors on financial and strategic matters. They provide knowledge, counsel, and expert skills that might not otherwise be available.
  • It provides a trading and dealing platform for many different shares, stocks, bonds, derivatives, and other financial instruments.
  • Stricter financial market laws and regulations foster trust among investors and firms, which helps to grow the economy.
  • create a platform for international borrowing and lending of money in different currencies

Disadvantages

  • The process could get too drawn out if regulatory agencies impose too many steps.
  • Some companies are unable to access the financial sector because of rigorous laws and regulations. They cannot set up resources that require ongoing oversight and compliance checks.
  • Investors may lose money as a result of ignorance or lack of information about the situation.
  • A company’s focus could change from investors to profits. The Board of Directors must adopt decisions that are in the best interests of all parties involved in the business and refrain from using investor funds for personal advantage.

Which is India’s Largest Financial Market?

The main financial market in India was founded in 1992 and is called the National Stock Exchange. It was recognised as a stock exchange under the Securities Contracts (Regulation) Act of 1956, and it started operating in 1994. It was the first entirely computerised electronic trading exchange in the nation.

  • Mumbai, Maharashtra, serves as the home base for the National Stock market, an Indian stock market. It is India’s largest stock exchange by daily turnover and number of trades for both equity and derivatives trading, and it is the eleventh-largest stock exchange in the world by market capitalization.
  • The NSE had about 2000 listings as of August 2021 with a market capitalization of more than US$3.4 trillion.
  • The NSE and the Bombay Stock Exchange are India’s two most significant stock exchanges, accounting for the vast majority of share transactions despite the existence of numerous other exchanges.
  • The S&P CNX Nifty, also referred to as the NSE NIFTY (National Stock Exchange City), is an index of fifty big stocks that is weighted according to market capitalisation.
  • Although a number of the biggest banks, insurance companies, and other financial intermediaries in India control a portion of NSE, its ownership and administration are two distinct entities.
  • NSE shares has been acquired by at least two foreign investors, NYSE Euronext and Goldman Sachs. As of 2006, there were 2799 Stock NSE VSAT terminals covering more than 1500 cities across India.

FOLLOW OUR WEBSITE:https://learningsharks.in/

FOLLOW OUR PAGE:https://www.instagram.com/learningsharks/

Stock Market Courses in Noida

1. Stock Market Crash Course

cbse board result

Stock Market Trading and Investment Crash Course

This brief course covers all the strategies required to excel in the stock market. The research of numerous equities will benefit from this, assisting traders in making the greatest trades. Are you open to learning how to trade or make stock market investments? Let’s be honest! YouTube does not have all information. The finest thing you can do for yourself is to find a mentor from whom you can learn. Spend money on yourself now!

You will be instructed by highly qualified mentors who are regarded as some of the best traders and mentors.


This stock market trading course is perfect for you if you want to start trading stocks online to make additional money or if you want to make trading your secondary source of income (like our Traders).

Lanuage: Hindi & English

Difficulty: Beginner

(FEES MAY VARY FROM LOCATION TO LOCATION)

In this Stock Market Crash Course

You’ll pick up stock trading skills. It serves as training for both newcomers and beginners.

Risk and money management are the two key components of trading.

Anyone may become an expert investor in the stock market, and those who truly understand the underlying concepts and recommended procedures will be able to achieve even their most difficult financial goals and lead the life of their dreams.

Unfortunately, many consumers do not have access to essential learning resources and industry best practises that could mean the difference between successful and unsuccessful stock trading.

YOU WILL LEARN HOW TO BE A SUCCESSFUL STOCK TRADER AND INVESTOR FROM THE COMPLETE COURSE.

Available Online & offline Batches

Morning Batch 10-12 PM ( Offline & Online)

Afternoon Batch 12-2 PM ( Offline & Online)

Evening Batch – 6-8 PM ( Offline & Online)

Late Evening Batch 8-10 PM ( Online )

Saturday and Sunday Batch ( ( Offline & Online)

Fee Structure

One-Time Fees: 17,000

In Installments: 18,000

(FEES MAY VARY FROM LOCATION TO LOCATION)

2. About Financial Derivatives (Options & Futures) Course

Learning sharks

Course Information: Derivative Analysis (Options & Futures)
Derivatives are therefore secondary securities whose value is exclusively based on the value of the original security to which they are tied, also known as the underlying. Typically, derivatives are regarded as professional investment.

Introduction to financial derivatives analysis course

First off, this introductory course on derivative analysis will teach you the foundations. Additionally, You’ll be able to distinguish between them. It is obvious that there are forward, futures, options, and swaps contracts. Excel is also used to calculate gains and losses for different contract types.

You’ll also have a basic understanding of derivative contracts by the end of this course. Again, you’ll need to move on to more complicated subjects like pricing derivatives. dealing in the futures market is also included.

Available Online & offline Batches

Morning Batch 10-12 PM ( Offline & Online)

Afternoon Batch 12-2 PM ( Offline & Online)

Evening Batch – 6-8 PM ( Offline & Online)

Late Evening Batch 8-10 PM ( Online )

Saturday and Sunday Batch ( ( Offline & Online)

Language: English & Hindi

Time Duration: 1.5 Months

Fee Structure: 17,000

(FEES MAY VARY FROM LOCATION TO LOCATION)

3. Technical Analysis Course

Learning sharks

BEST SELLING COURSE

About Technical Analysis Course​

In stock trading, technical analysis is one of the most crucial components. It alludes to the forecasting of expected price fluctuations based on historical patterns. Although. The “backbone” of stock market trading is frequently referred to as technical analysis. It is intended for those who are just beginning their exploration of charts and technical analysis.

Every trader who uses technical analysis had no prior knowledge of anything. There is information available on numerous websites that should be used, but it’s crucial that we maintain organisation to avoid getting overwhelmed and that we can focus and apply our knowledge to what’s most important.

In addition, technical analysis emphasises the study of price and volume as opposed to fundamental analysis, which focuses on other factors. Additionally, fundamental analysis seeks to determine a security’s value based on financial results like sales and earnings.

Available Online & offline Batches

Morning Batch 10-12 PM ( Offline & Online)

Afternoon Batch 12-2 PM ( Offline & Online)

Evening Batch – 6-8 PM ( Offline & Online)

Late Evening Batch 8-10 PM ( Online )

Saturday and Sunday Batch ( ( Offline & Online)

Language: English & Hindi

Time Duration: 2 weeks

Fee Structure: 19,000

(FEES MAY VARY FROM LOCATION TO LOCATION)

4. Fundamental Analysis Course

Learning sharks

About Fundamental analysis Course

Fundamental analysis is a technique for calculating a security’s fundamental worth. Analysis of several macroeconomic and microeconomic aspects of accounting and finance is also important. However, the ultimate goal of fundamental analysis is to ascertain a security’s intrinsic value. On the other hand, to help with investing decisions, the intrinsic value of the security can then be compared to its current market price.

A number that can be compared to the current price of a securities is the final goal of this fundamental analysis course. Consequently, to ascertain whether it is overvalued or undervalued.

By examining historical market data, technical analysis predicts the course of prices. Price and volume are thought to be in opposition to this stock analysis methodology.

Available Online & offline Batches

Morning Batch 10-12 PM ( Offline & Online)

Afternoon Batch 12-2 PM ( Offline & Online)

Evening Batch – 6-8 PM ( Offline & Online)

Late Evening Batch 8-10 PM ( Online )

Saturday and Sunday Batch ( ( Offline & Online)

Language: English & Hindi

Time Duration: 1.5 Month

Fee Structure: 17,000

(FEES MAY VARY FROM LOCATION TO LOCATION)

5. Shark Trade Course

Learning sharks

SHARK TRADER- STOCK MARKET COURSES

Stock market: The Shark Trader 5 distinct modules make up the course. Derivative analysis, technical analysis, stock market psychology, and stock market fundamentals. Only 10% of this training is theoretical and 90% is practical.

Recommend For Beginners

THE SHARK TRADER COURSE  WILL TEACH YOU HOW TO BE A SUCCESSFUL STOCK INVESTOR

The course’s in-depth, advanced content can help you trade effectively and with confidence. In addition to learning how to test and refine your own trading strategy, you will obtain a complete grasp of what makes an effective trading strategy.

Available Online & offline Batches

Morning Batch 10-12 PM ( Offline & Online)

Afternoon Batch 12-2 PM ( Offline & Online)

Evening Batch – 6-8 PM ( Offline & Online)

Late Evening Batch 8-10 PM ( Online )

Saturday and Sunday Batch ( ( Offline & Online)

Language: English & Hindi

Time Duration: 3 Months

Fee Structure

One -time : 37,000

Installments: 42,000

Difficulty: Beginners

(FEES MAY VARY FROM LOCATION TO LOCATION)

6. Shark Trader Pro

learning sharks

Most Valuable Stock Market Trading Course – Shark Trader PRO

SHARK TRADER PRO – TRADING & INVESTING

There are 5 modules total in this course. Stock market Psychology, technical analysis, fundamental analysis, derivative analysis, and stock market basics. Only 20% of this training is theoretical; the other 80% is practical.

The in-depth, cutting-edge material in the Shark Trader PRO course can help you trade effectively and with confidence. In addition to learning how to test and refine your own trading strategy, you will obtain a complete grasp of what makes an effective trading strategy.
Both intermediate and advanced topics are covered in this course. You’ll leave with a new, less purely theoretical approach to data analysis.

Available Online & offline Batches

Morning Batch 10-12 PM ( Offline & Online)

Afternoon Batch 12-2 PM ( Offline & Online)

Evening Batch – 6-8 PM ( Offline & Online)

Late Evening Batch 8-10 PM ( Online )

Saturday and Sunday Batch ( ( Offline & Online)

Language: English & Hindi

Time Duration: 6 Months

Fee Structure

One -time : 49,900

Installments: 55,500

(FEES MAY VARY FROM LOCATION TO LOCATION)

FOLLOW OUR PAGE: https://www.instagram.com/learningsharks/

Why is Learning Sharks considered to be the best Stock Market Institute?

Are you an amateur or an expert? We receive students who are absolute beginners. We advise learning the fundamentals of the stock market first. This one month course covers more than just what NSE and BSE are. or stock market terminology and understanding. It covers every aspect of the stock market that you should know about. A cum trading specialist will cover these subjects.

Best Training Institute for Stock Market in Noida

First of all, since 2016, Learning Sharks has been a reputable stock market institute for stock market courses. In addition to teaching the fundamentals of the stock market, share market training programmes often cover technical analysis and derivatives analysis.
In fact, there are 10+ premium share market courses for beginners and 15+ experienced mentors and traders. Similar to this, Learning Sharks is ranked as one of the top stock market schools. Furthermore, real-world trading experience on the NSE, BSE, commodities (MCX), NCDEX, and currency markets
Starting today, let’s invest in the stock market utilising basic research and mutual funds. Not to mention, we study for NISM/NCFM certification examinations as well as jobs in addition to intraday trading.

Also, Our Institute have different types of Stock Market Courses. And That Courses will help you alot to understand about Stock Market.

Let’s have a look for it:

1. Derivative Analysis Course (futures and options)

Derivatives Analysis Course

The fundamental information you need to know about derivatives is covered in this introductory course. The differences between forward, futures, options, and swaps contracts will become clear to you. Additionally, you will work with real-world Excel examples to figure out the profits and losses associated with each form of contract. You will have the fundamental understanding of derivative contracts at the end of this course, allowing you to move on to more complicated subjects like derivatives pricing and trading.

2. Technical Analysis Course

Technical Analysis Course

Technical analysis is a tool used by financial professionals to forecast future market performance by using historical market data. These indicators are used by analysts to interpret price changes, forecast timescales, and comprehend market volatility.

Technical analysis patterns might reveal hints about the future performance of particular financial products. The goal of this active management strategy is to arm advisors with the knowledge they need to decide on behalf of their clients, organisations, and selves. Technical analysts can better manage wealth for all stakeholders by being more accurate about upcoming price fluctuations. These predictions are more accurate than ever thanks to modern technology.

3. Fundamental Analysis Course

Fundamental Analysis Course

As long-term investors, many investors purchase and keep equities. So, acquiring a fundamental understanding of a company’s financial operations is done through fundamental analysis of an organisation. In other words, it helps potential investors understand the underlying idea around which the company was built. It’s also a method for investors to identify companies with strong fundamentals and make long-term investments in them. Examining a range of fundamental signs and elements is how this is done.

4. Psychology And Risk Management

Risk and Psychology Management Course

The last but not least are risk management and psychology. This section is the most crucial and covers over a hundred subjects, such as what to anticipate, hazards, and a lot more.

There is a paid internship after you finish this two-month course. where you sit down and take 100 deals with your cohort mates. Trades might be done in the classroom or afterward. You will be paired with a trading partner who has years of expertise and who will help you along the way. He is adept at managing a novice trader. After all, he was once a novice himself.

He will be the ideal trading pal in addition to the classmates and professors. He can hear about your trades through. He will prevent you from placing trades that will result in losses and reports to all the mentors. When the trade is appropriate, a green flag will encourage you.

Is this it? Since you read all the way to the end, there is one more surprise. We give students up to Rs.10 million in funding. You get to practise trading with our money while you’re an intern.

You keep the 70% profit if you are able to maintain profitability. It’s all our fault if you lose. Also, all of the money is real.

Now, how does that sound? Isn’t it too good to be true? I guess. You now understand why “learning sharks” is regarded as the top stock market school.

need more time to decide? if you’re still interested in learning from us “how to trade” in the stock market. Take as much time as you need.There is no haste.

FOLLOW OUR PAGE ON INSTAGRAM: https://www.instagram.com/learningsharks/

What is Online Trading in Stock Market?

Online trading allows you to trade independently, without a broker's interference
Online Trading

Online trading has greatly simplified and expedited the process of purchasing and selling shares. Trading can now be done instantly and remotely from anywhere thanks to the internet, which has taken over the world stage. It is essential to the life of a trader or investor. Through an online trading platform, it makes it easier to buy and sell financial items like stocks, bonds, NCDs, equities, and ETFs.

Before digitalization, a shareholder would call their broker and ask to acquire stocks at a certain price if they wanted to purchase shares. The broker will then confirm the order after speaking with their client about the share’s current market price. The order would be registered on the stock exchange following this tiresome process.

How to Trade Online?

  • Applying for a Demat and trading account with a Depository Participant and completing all required documentation processes is the first step in beginning to trade online. The Securities and Exchange Board of India (SEBI) certification and registration with all stock exchanges are both crucial requirements when selecting a broker.
  • You must have sufficient knowledge of how the stock market operates before you begin online trading. The fundamentals of online trading are covered in a variety of courses. In addition, to stay informed about the financial markets, you should monitor financial news, websites, and podcasts.
  • Making a plan and coming up with a strategy are also very important. It’s recommended that you start practising with a demo trading account before you start investing with real money. This will provide you the opportunity to become familiar with price dynamics and create the trading technique you want to use.

Consider your investment tactics carefully. The amount you want to invest in a particular company should be planned out in advance.

Being a successful investor requires having all of your bases covered because stock trading is a long-term investment.

Benefits of online trading:

1.Simple & Convenient process: Everything that can be done online simplifies and makes life more convenient. Online trading makes it possible for traders to do transactions without fuss. You can save time and effort if you have an internet connection and an online demat account.

2.Less Expensive: You must pay a charge or commission to a broker when they carry out your trades, which increases the cost to you. However, you pay a cost, or a brokerage charge, when you trade online that is significantly less than the fee levied by the broker.

3.Complete Control: Online trading enables you to have total control over your own portfolio, providing you more power over your assets. Now, you can trade whenever the market is open and make decisions on your own without the broker’s involvement.

4.Monitor Investment All time: Through websites and mobile applications, investments can be followed up on at any time. You may quickly decide which equities you want to maintain or sell by viewing real-time gains and losses.

How does online trading work?

Now that you know the definitive answer to “What is meant by online Trading?” It’s time to understand how to carry out a trade or how internet trading functions. Within a few seconds, the order to buy or sell shares is carried out. The steps are listed below:

  • When you put a buy or sell order, the trade is carried out in accordance with the optimal buy and sell prices.
  • A trade confirmation message is given to clients by stockbrokers and exchanges following execution.
  • The stockbroker sends the clients a contract note including information about the trades that were executed.
  • Once the buy and sell orders are matched, the trade is carried out, and the clearing procedure is started.
  • The T+2 settlement cycle applies to all equities sector trades. (As of right now, exchanges have developed a T+1 settlement cycle that will be carried out in stages.
  • The following stage entails settling the transaction for the buyers and sellers and completing the financial obligations indicated in the clearing step.
  • The trade is deemed settled if the buyer receives the securities and the seller receives the money.
  • Once the aforementioned steps have been followed, the shares are transferred to the buyer’s Demat account via the appropriate depositories, and the proceeds from the sale of the share are credited to the seller’s account.


Online Trading vs Offline Trading

With the development of the internet over the past twenty years, the advantages of online commerce over offline trading have been apparent. A few distinctions between online and offline trading will be discussed.

Ease of trading:Trading can be done effortlessly without a broker thanks to online trading. A trader using an offline account, on the other hand, is totally reliant on the broker’s services and is given specific instructions. All trading is done through the broker. When you choose to trade online, this dependence is non-existent.

Convenience:With online trading, you may conduct business at any time and from any location as long as you have access to the internet. On the other hand, when trading offline, you must appear in person at the broker’s office or request that your broker place a deal on your behalf.

 Trading fees:The incredibly reduced brokerage costs associated with online trading result in increased profits. On the other side, brokers and brokerage firms in offline trading demand high costs that reduce your profit.

Things to Remember Before You Start Online Trading

  • Having a Demat and trading account is required.
  • Choose a broker who can suit your needs.
  • Gather sufficient information and conduct analysis before making deals.

How to Make Lots of Money in Online Trading

1.Research current trends: Market trends are covered by numerous reliable sources. You could wish to get a subscription to a stock trading publication like Bloomberg BusinessWeek, Traders World, Investor’s Business Daily, Kiplinger, or Investor’s Business Daily.You might also subscribe to the blogs of reputable market experts, such as Abnormal Returns, Deal Book, Footnoted, Calculated Risk, or Zero Hedge.

2. Select a trading website: Scottrade, OptionsHouse, TD Ameritrade, Motif Investing, and TradeKing are a few of the top-rated websites. Before choosing a website to use, make sure you are informed of any transaction fees or percentages that will be applied.

  • Verify the reliability of the service you utilise. Consider reading internet evaluations of the company.
  • Choose a firm that offers features like a mobile app, investor education and research tools, affordable transaction costs, easily readable data, and round-the-clock customer support.

3. Create an account with one or more trading websites: Although you probably won’t need more than one, you could want to start with two or more so you can subsequently narrow down your options to the one you want.

  • Make sure to review each site’s minimum balance requirements. You can be limited to setting up accounts on one or two websites by your budget.
  • Starting little may prevent you from using other trading platforms because they need larger minimum amounts.

4.Practice trading before you put real money in: Some websites, such ScottradeELITE, SureTrader, and OptionsHouse, provide a simulated trading environment where you can test your trading strategies without risking any real money. You can’t make money this way, of course, but you also can’t lose it.Trading in this way will help you become accustomed to the strategies and decision-making processes you will encounter when trading, but it is generally a poor depiction of genuine trading.

When purchasing and selling stocks in actual trading, there will be a delay, which could lead to prices that are different from what you were hoping for. Furthermore, trading with virtual currency won’t adequately prepare you for the pressure of trading with actual money.

5.Choose reliable stocks: Although you have many options, you should eventually buy shares from businesses that are leaders in their industry, have a product or service that consumers continually desire, have a strong brand, a solid business strategy, and a track record of success.

  • To determine a company’s profitability, look into its public financial reports. A more lucrative business typically has a more lucrative stock. Any publicly traded company’s most recent annual report can be found on their website, where you can also obtain detailed financial information. You can contact the business and ask for a hard copy if it is not available on the website.
  • Consider the business’s most disastrous quarter ever to assess whether the chance of a repeat is worth the possibility for profit.

FOLLOW OUR WEBSITE: https://learningsharks.in/

FOLLOW OUR PAGE: https://www.instagram.com/learningsharks/

What is Trading in Stock Market?

Trade is the voluntary exchange of goods or services between different economic actors.
Stock Market Trading

The voluntary exchange of commodities or services between various economic entities is referred to as trade. A transaction will only take place if both parties believe it will advance their interests, as there is no obligation on the part of the parties to trade.

In certain circumstances, trade might have more precise connotations. Trade in the financial markets refers to the buying and selling of derivatives, commodities, and securities. Free commerce refers to cross-border exchanges of goods and services that are unhindered by tariffs or other trade restrictions.

KEY TAKEAWAYS

  • The voluntary exchange of commodities or services between economic players is referred to as trade.
  • Since interactions are voluntary, trade is typically thought to be advantageous to both sides.
  • Trading in finance is the buying and selling of securities or other assets.
  • According to the comparative advantage hypothesis, trade is advantageous to all parties involved.
  • The majority of traditional economists support free trade, although some development economists think protectionism has benefits.

If you wish to trade stocks, you need be well-versed in the stock market’s fundamentals. These days, investing is absolutely necessary since saving all of our money is not enough to keep up with inflation and achieve all of our financial goals. You can select from a variety of investment choices based on your preferences and needs. Unlike investing, which typically employs a buy-and-hold approach, it entails active engagement in the financial markets.

Types of Trading in Stock Market

Scalping is also known as micro-trading. Basically, it is a subset of intraday trading.
Types of Trading
  • Scalping : Microtrading is another name for scaling. It is essentially a division of intraday trading. It is a trading strategy that is focused on making money despite slight price movements. Several times a day can be done. Even while not every transaction results in a profit, in rare cases a trader’s gross losses may outweigh their earnings. Therefore, the trader needs a robust exit strategy to prevent significant losses that could wipe out his prior gains. In this instance, compared to day trading, the holding duration of the shares is shorter. This calls for knowledge of the market, proficiency, awareness of changes in it, fast transactions, and a firm will to succeed.
  • Day Trading : In this type of trading, stocks are bought and sold all in the same day. Such deals require the trader to terminate the position before the market closes for the day. Day trading calls for knowledge of market issues and a solid grasp of market volatility. Day trading is therefore primarily carried out by knowledgeable investors.
  • Swing Trading : This type of trading is employed to profit on transient stock patterns. This method is utilised to profit from stock shortly after buying it. Investors that engage in swing trading frequently rely on technical analysis to forecast market direction (charts, patterns, etc.).
  • Momentum Trading : Stock prices are said to have developed momentum when they increase over an extended period of time. The goal of momentum trading is to make money off of this price movement. They buy with the intention of selling when the peak is reached. In this case, it can take a few hours or days until you see the anticipated benefit. Additionally, the goal is to buy shares in bulk to realise significant gains.

How Trade Works in Stock Market?

Buy and sell shares of businesses that are listed on the two major stock exchanges:

  • The National Stock Exchange (NSE)
  • The Bombay Stock Exchange (BSE).

One who purchases shares acquires certain ownership in the business and is qualified for a specific stake.

The way the stock market operates is as follows:

  • An initial public offering (IPO) allows a business to list on the main market.
  • The distribution of the shares happens on the secondary market.
  • Investors trade the issued equities in the secondary market here.
  • Stockbrokers and brokerage businesses, which are listed with the stock exchanges, provide investors and traders with the opportunity to purchase shares at a specified price.
  • The exchange then looks for a sell order for your buy order after receiving it from your registered broker.
  • The order is ready to be executed after the buy and sell orders have matched.
  • The entire process takes T+2 days, which means that two working days after you place your order, your purchased shares will be deposited in your Demat account.

Example
At a price of Rs. 10, an investor owns 5000 shares of ABC Limited. Later, he notices that share prices are increasing and chooses to sell 2000 shares at a price of 20 rupees per share on the first day, and the remaining 3000 shares the next day at a price of 25 rupees per share.

Calculating profits and losses

={[200020]+[300025]-[5000*10]

=[40000+75000]-50000

=115000-50000

(Profit) = 65000

What is online trading?

Opening a Demat and Trading Account with any SEBI-registered broker that provides online services is all that is necessary to get started with online trading.

All you need to open an account quickly is a PAN card, address verification, an AADHAAR card, a mobile number connected to the AADHAAR, a bank statement, a cancelled check leaf, and a photo.

You can make trade orders or cancel orders in online trading at your convenience and from the comfort of your home. You can also purchase mutual funds, shares, or IPO investments.

Online trading has greatly simplified and expedited the process of purchasing and selling shares. Trading can now be done instantly and remotely from anywhere thanks to the internet, which has taken over the world stage. It is essential to the life of a trader or investor. Through an online trading platform, it makes it easier to buy and sell financial items like stocks, bonds, NCDs, equities, and ETFs.

Before digitalization, a shareholder would call their broker and ask to acquire stocks at a certain price if they wanted to purchase shares. The broker will then confirm the order after speaking with their client about the share’s current market price. The order would be registered on the stock exchange following this laborious process.

Advantages of trading

  • Relatively good returns: One benefit of trading is that a focused trader with analytical abilities has the ability to generate a respectable return in a short period of time. This makes the job lucrative, especially if you have effective risk management skills. Low interest rates and strong inflation make trading stocks even more alluring.
  • High liquidity: When compared to other asset classes, like real estate, stock markets offer liquidity that is unmatched. In other words, leaving the market is simple and doesn’t cost anything. This is another benefit of trading because it enables you to spend extra money and is more profitable than putting it in savings accounts.
  • High transparency: Online trading has increased trade and pricing transparency as compared to the ring-based trading system. With this method, you may directly place “buy” and “sell” orders (without the assistance of your brokers’ personnel), set price limits, create a stop loss (and keep modifying it), find out the order’s status, and keep track of when it will be executed. Online trading has also increased the benefits of trading by lowering costs for both investors and traders.
  • Easy access to back-end accounts: Additionally, online trading makes sure that you always have access to your back-end accounts, allowing you to keep track of your stock and cash positions. The online method also guarantees that you have quick access to all of your prior investment statements.

Disadvantages of trading

  • Highly volatile: The stock market is highly dynamic and erratic. The world in which we live is rapidly becoming more technologically advanced. The price of the stock you are holding could be impacted by an incident anywhere in the world. In addition, stock values fluctuate frequently during a single trading day. On other days, when significant events like the Budget, elections, and news on the GDP and the performance of top companies occur, volatility reaches its height.
  • Highly risky: Market volatility and unpredictability make it extremely risky, particularly for novice traders who lack access to high-quality research. Stock trading can quickly deplete your entire capital if adequate protections are not implemented at the right time.
  • Impulsive decisions: Newcomers are frequently tempted to make rash decisions by the simplicity of creating accounts with brokers and the requirement for a minor initial deposit. They wind up suffering significant losses as a result of their ignorance and inability to distinguish between rumours and actual information. Even while the industry is not inherently bad, in this case, such circumstances mostly result from a lack of investor awareness activities.
  • Malpractices: Despite the regulator’s increased monitoring, some people continue to abuse the system’s flaws. As a result, some traders have an advantage since they have access to information about, among other things, purchases made by people close to management, anticipated firm performance, and auction data made public by stock exchanges.

Advantages of Opening a Trading Account

Trading Accounts provide investors with a variety of advantages, enhancing the strength and effectiveness of the share trading ecosystem. The following list of benefits includes a few of them:

Simply put, this is how trading and investing vary from one another.

  • Period : In trading, stocks are often kept by the investor for a little time (a week or a day), whereas in investing, a technique based on the buy and hold principle, the investor may also invest for a number of years.
  • Capital growth :  Trading involves watching the price changes of stocks, and if a rise in price is seen, the trader will sell the stock to realise a profit. In contrast, investing calls for a patient approach. Compound interest is what builds wealth over time.
  • Risk : Risks are included in both trading and investing. Comparatively speaking, trading has greater risks because the price may quickly increase or decrease. However, investing is an art that takes time to master. As a result, the risk is smaller.

Trading vs Investing

Both trading and investing are significant components of wealth creation. For instance, you and your brother both purchased an equal number of seeds, which you then sold to a customer on the same day in order to make a profit. However, your brother planted the seeds and allowed them to develop for a year so that they would produce fresh seeds. He sold the land, but he kept planting fresh seeds and raising crops. He too gained money by investing in his seeds, but his strategy was different from yours.

  • Identity Validation: PAN Card Address Proof: Last three months’ bank statement, Aadhaar card, passport, driver’s licence, or voter identification
  • Bank information Any bank document including the client’s name, account number, and IFSC code, such as a cheque or passport
  • Income Proof: Either a bank statement for the previous six months, a three-month pay stub, a net worth statement, a holding report, an ITR statement, or a demat holding statement.

FOLLOW OUR WEBSITE: https://learningsharks.in/

FOLLOW OUR PAGE: https://www.instagram.com/learningsharks/

What is Technical Analysis in Stock Market?

By examining statistical trends gleaned from trading activity, such as price movement and volume, technical analysis is a trading discipline used to assess investments and spot trading opportunities. Technical analysis focuses on the analysis of price and volume as opposed to fundamental analysis, which seeks to determine a security’s worth based on financial metrics like sales and earnings.

KEY TAKEAWAYS

  • Technical analysis is a trading strategy used to assess financial investments and spot trading opportunities in price movements and chart patterns.
  • According to technical analysts, a security’s previous trading activity and price changes can be useful predictors of the security’s future price moves.
  • In contrast to technical analysis, which concentrates on recent price patterns and stock trends, fundamental analysis concentrates on the financials of a company.

Understanding Technical Analysis

The impact of supply and demand on changes in price, volume, and implied volatility is examined using technical analysis tools. It operates under the presumption that, when combined with suitable investing or trading rules, historical trading activity and price changes of a security can serve as valuable predictors of the security’s future price movements.

It can help improve the assessment of a security’s strength or weakness compared to the overall market or one of its sectors. It is frequently used to generate short-term trading signals using different charting tools. Analysts can refine their overall valuation estimate by using this information.

Charles Dow and his Dow Theory made technical analysis what it is today in the late 1800s.
William P. Hamilton, Robert Rhea, Edson Gould, and John Magee were among the notable researchers who added to the Dow Theory’s foundational ideas. Today’s technical analysis has progressed to incorporate a large number of patterns and signals that have been established through many years of study.

Using Technical Analysis

Technical analysis is frequently used in conjunction with other types of study by professional analysts. Retail traders may base their conclusions only on a security’s price charts and comparable data, but in practise, equity analysts rarely confine their research to just fundamental or technical analysis.


Any security with a trading history can benefit from technical analysis. Stocks, futures, commodities, fixed-income, currencies, and other assets are included in this. Technical analysis is actually much more common in the commodities and currency markets, where traders pay attention to short-term price changes.

Stocks, bonds, futures, and currency pairs are just a few examples of tradable instruments that are typically subject to forces of supply and demand and can be predicted using technical analysis. In fact, some people think that technical analysis is just the study of supply and demand dynamics as they manifest themselves in changes in a security’s market price.

The most typical application of technical analysis is to price fluctuations, although some analysts also keep track of other metrics like trade volume or open interest levels.

Fundamental Of Technical Analysis

We must presume that previous chart patterns and future stock prices are somehow related in order to use technical analysis to forecast stock prices. Only in this way can we use historical data to accurately forecast future pricing. The technical analysis of equities is predicated on three key tenets.

  • Market Prices Reflect All The Information About A Stock

We previously stated that fundamental analysis is concerned with the financial and other details of a stock. Despite being entirely separate from fundamental research, technical analysis of equities operates on a similar principle.

If you are a technical analyst, you can think that all stock market participants are well informed about a stock. When they decide to buy or sell something, they genuinely use this information.

The stock price and, ultimately, the stock chart are updated to reflect this information. They do not consider fundamental variables, instead focusing primarily on chart patterns to determine market trends.

  • Patterns Tend To Repeat Themselves

The final supposition supporting a technical analysis is that trends repeat themselves. In other words, imagine that a stock chart follows a hypothetical A-B-C pattern. Therefore, each time we get to “C,” we’ll start over at “A,” then move on to “B,” and finally “C.” Without fail, this trend will continue.

You can use technical analysis to forecast future stock values only after you have made this assumption. Without this presumption, a chart cannot be used to predict where the price will move next.

  • Stock Prices Follow Trends

The foundation of technical analysis of stocks is the notion that every stock chart has a distinct trend of its own. Only within this trend do prices change. Every change in the stock price signals the following action. Consider the fictitious ripple as an example.

You can predict that a stone will cause a series of ripples to appear in a pond when you throw it. The trend will fizzle out after a few tremors. However, a similar ripple will reappear the following time you throw a stone.

  • Charts

The most often utilised technical indicators for technical analysis are price and volume charts. A volume chart shows how many shares of a company were bought and sold throughout the day.

You can select one of the standard line or bar charts for technical analysis, or you can utilise a candlestick chart instead. A unique type of chart that is particularly useful for technical analysis is the candlestick chart. It takes the shape of a line of subsequent candles. In the section on stock charts, we’ll go into more detail about candlestick charts. Trendlines are used in conjunction with charts.

Trendlines show a stock’s movement over time in one direction or another.

  • Moving Averages

In order to eliminate sudden, frequent changes in a stock chart, moving averages are calculated. Stock values can occasionally change dramatically in a short amount of time.

As a result, finding a trend in the stock chart is challenging. A few days’ worth of prices are averaged to reduce the effect of this and highlight a pattern. It is challenging to determine the direction in which prices have truly changed, for instance, if a stock’s price over the last five days has been Rs. 50, 53, 47, 45, and 52. However, you may identify a general trend by calculating the average of these values and comparing it to the average of the following five days and the five days prior.

Importance Of Technical Analysis

  • Mathematical Approach

To choose stocks, technical analysts use probability. They can forecast an action’s consequence using probability without necessarily having to examine it in great depth.

Therefore, technical analysis predicts price movements without forcing you to think about the specifics that will drive those movements. In comparison to fundamental analysis, it is considerably quicker and easier.

  • Signs Of Upcoming Danger

There are instances when a significant decline in stock prices is imminent but nobody can see it coming. Tools for fundamental analysis cannot foresee it. However, the fall can be predicted using previous chart patterns and other analytical methods.

Technical analysis, of course, cannot explain why a price is falling, but it may predict when one will occur. You can accordingly get ready for it.

For instance, the US stock markets were doing well before the financial crisis of 2009. Nobody could have predicted a swift and significant decline in stock prices.

  • Identification Of Short-Term Trends

For investors who wish to make long-term investments, such as three to five years or more, fundamental analysis is increasingly pertinent. This is due to the fact that any lucrative business concept requires time to succeed.

Investors must therefore exercise patience as well. Technical analysis is an exception to this. Ultimately, a company’s profitability determines whether a stock will succeed or fail. Technical analysis cannot be used to anticipate this. It is limited to predicting whether the stock will move up or down in the near term.

Technical Analysis Of Stocks

The main goal of technical analysis is to interpret changes in stock prices and trading activity. However, it is not entirely straightforward to analyse and analyse it. It must be transformed into an understandable format. This data is best presented using stock charts. You can better comprehend stock chart patterns by using the chart patterns listed below.

  • Reversal Patterns

Reversal patterns suggest that the current trend in price movement can change. In other words, if a stock’s price is currently rising, it will begin to fall, and if it is currently falling, it will begin to rise.

Two significant reversal patterns exist:

  • Head and shoulders pattern
Head and Shoulder Pattern in Stock Market
Head and Shoulder Pattern
  • Inverse Head And Shoulders Pattern

An uptrend is reversed when a head and shoulders pattern appears. But because it is a reversal pattern, it should also signal the conclusion of a downtrend, or a time when prices have been declining steadily. The upside-down formation of the head and shoulders motif indicates such a reversal.

Such a reversal is indicated by the head and shoulders pattern when it is formed in an upside-down fashion.
Inverse head and shoulder pattern
  • Double Tops Pattern

There is a double top after a strong upswing. Instead of three waves, it only has two. The cost is the same at both peaks, unlike head and shoulders. The decline when the trend eventually reverses will be greater the longer the period and the fall between the two waves. Similar to the head and shoulders pattern, the formula for determining the target price also applies to double tops.

A double top occurs after a significant uptrend. It contains two waves instead of three.
Double top pattern
  • Double Bottom Pattern

A double bottom pattern, which resembles a water image of the double top pattern, appears after a period of consistently declining prices.

A double bottom pattern follows a spell of constantly falling prices
Double bottom pattern
  • Contiunation Patterns

The trend that was depicted by a stock chart before to the development of the pattern would likely continue in the future, according to continuation patterns. For instance, if the price was rising, it would keep doing so. Similar to how it would keep going lower if that was its direction.

if the price was heading higher, it will continue to do so. Similarly, if it was heading lower, it will continue to do so.
Continuation pattern
  • Triangle pattern

A triangle pattern develops when the distance between the peaks and bottoms on a stock chart keeps getting smaller. As a result, they will converge if trend lines are added for tops and bottoms, respectively. As a result, the design will appear to be a triangle. One of the three causes described below results in a smaller discrepancy between tops and bottoms.

While the peaks remain stable, bottoms are rising.

While the bottoms are stable, the tops are falling

Tops and bottoms are overlapping.

Ascending, descending, and symmetrical triangles are produced by these patterns, respectively.

When the difference between the tops and bottoms on a stock chart is constantly reducing, it forms a triangle pattern.
Triangle chart pattern
  • Rectangle Pattern

When a stock’s price has been fluctuating within a range, a rectangular pattern develops. Every upward move and every downward move come to an identical top and bottom. In other words, the top and bottom prices remain stable over time.

A rectangular pattern is formed when a stock’s price has been moving within a range.
Rectangle Chart pattern

FOLLOW OUR WEBSITE: https://learningsharks.in/

FOLLOW OUR PAGE: https://www.instagram.com/learningsharks/

Stock Market WhatApp Group Links of June 2023

WhatsApp group links for Stock Market for 2023
WhatsApp Group Links for Stock Market

What is WhatApp?

With just a Wi-Fi connection, WhatsApp is a free, cross-platform messaging programme that enables you to make video and voice conversations, send text messages, and more.

WhatsApp, which has over 2 billion active users, is particularly well-liked among friends and family who wish to stay in touch but live in different countries.

WhatsApp’s widespread acceptance is largely a result of its usability across platforms, accessibility, and clear, uncomplicated features.

Although WhatsApp may not be widely used in the US, it is a vital component of daily life in many other countries. Undoubtedly one of the most used messaging platforms worldwide is the Facebook-owned app.

Knowing that WhatsApp was one of the first mobile apps to provide free, internet-based chatting can help you understand why it is so popular. WhatsApp generally uses a Wi-Fi connection to send and receive messages and calls for free, as opposed to sending texts via cellular data networks, where costs may be involved.

Now, fast forward: Over 2 billion users use WhatsApp because it makes communicating easy regardless of device or location.

WhatsApp is not only easy to use, but it also provides significantly more capabilities and customizations than standard SMS messaging – all for free. If you’re already familiar with the app, our favourite WhatsApp tips and tricks might be of interest to you.

How does WhatsApp work?

WhatsApp’s key selling point is its ability to be used essentially for free for international calling and for sending and receiving calls and messages utilising only an internet connection. There are no sign-up costs, and there are no data plan limits to be concerned about.

Even while WhatsApp is similar to other messaging apps like iMessage and Messages by Google, it nevertheless has several distinct advantages, the most important of which is cross-platform compatibility (for example, between Android and iOS).

  • Phone and video calls: In addition to phone conversations, WhatsApp also provides video calls, which include a group feature that supports up to eight callers at once.
  • You can record audio messages and transmit them to individual or group chats.
  • WhatsApp uses end-to-end encryption, a secure communication protocol, so that only the parties involved in a message can see it.
  • Sharing photographs and videos: You can share films, photos, and GIFs without being concerned that they will be pixelated or not downloadable, as can occasionally happen when SMS messages are sent across various mobile platforms and cellular carriers.
  • Sharing materials: Without the burden of email or additional document-sharing apps, WhatsApp enables you to transfer various types of documents, including PDFs, spreadsheets, and slideshows.
  • Desktop accessibility: Both a Mac and a PC desktop version of WhatsApp are available.
  • WhatsApp Business: WhatsApp’s dedicated business account was created to allow business owners to communicate with their clients and exhibit their products on a user-friendly and simple platform.

Key differences between WhatsApp group and WhatsApp business 

Like any other WhatsApp group, the WhatsApp Business Group allows several members to be added and chat together. This feature functions like a chat room where all of the group’s members can share files and converse. Every member of the group can see every chat that takes place.

Private communications can be delivered to numerous recipients simultaneously using the WhatsApp Business Broadcast feature. You must set up a Broadcast group, which is akin to a WhatsApp group, where numerous persons can be added (without anybody knowing who else is in the group), and communications submitted to group members are received as private messages.

To have a better understanding of these two groups’ fundamental differences, let’s greater understanding.

1. Features

WhatsApp Group: interacting and conversing with many people at once. The group’s entire membership is able to converse and discuss with one another.

WhatsApp Business:sending a private message with a similar message to several persons at once. The subscribers to the broadcast list are unaware of the other subscribers.

2. People Limitation

WhatsApp Group: A WhatsApp group can only have a maximum of 256 members added. You will need to form another group if there are more participants.

WhatsApp Business: The number of individuals who can be added to a WhatsApp business broadcast is unrestricted.

3. Message Sender

WhatsApp Group: Any group member in a WhatsApp group can send a message to the group, and all other group members can see such messages.

Although there is a setting that only allows the administrator to send messages

WhatsApp Business: Messages can only be sent by the person who created the broadcast list. These messages are transmitted as one-to-one chats, and if a response is sent, it will show up in that person’s chat window.

4. Message receiver

WhatsApp Group: The messages sent to a WhatsApp group will be seen by everyone who has been joined to it. Whether or not a member is saved to your address book, they can still view everything in the group.

WhatsApp Business: These messages can only be read by the contacts listed in your address book; anyone else won’t see them. WhatsApp won’t let you know whether a receiver has added or removed you from their address book. However, you can verify your delivery list to make sure some persons are not receiving your messages.

5. Chat History

WhatsApp Group: The messages in a WhatsApp group are not automatically preserved, but you can star any message that you want to keep.

WhatsApp Business: The WhatsApp list’s broadcast group messages are automatically saved as one-to-one conversation history.

6. Feature Using Occasion

WhatsApp Group: A WhatsApp group is the finest choice when a group conversation is required. Multiple users can interact, discuss, and exchange experiences with other members using this function. All of the members of a WhatsApp group have access to all messages and media files shared in the group.

WhatsApp Business: The greatest time to use a WhatsApp business broadcast list is when you need to distribute files, notices, and essential information to a large group of people. Since there is a great likelihood that crucial information would get lost among several group communications, a broadcast list is the most effective. Furthermore, broadcast message WhstaApp works best when you don’t want the group’s members to know who the other group members are.

7. Participants Reply

WhatsApp Group: Any member of a WhatsApp group can reply, and it is accessible to and received by all group members. These notifications show up directly in the group window.

WhatsApp Business: Private chat is how the messages from a broadcast list are delivered. All list members receive all messages in their individual chat windows, and any replies also show up there.

Advantages of WhatsApp Group and WhatsApp Business

WhatsApp Group: Using a WhatsApp group, you can have a discussion involving the ideas, thoughts, and viewpoints of many different people. It is possible to send information to numerous recipients at once.

WhatsApp Business: There is a good probability that among hundreds of communications, some persons will miss or lose critical information. As messages are delivered directly to the recipient conversation in this case, broadcast list proves to be the ideal choice. Additionally, the broadcast list is the ideal tool when you don’t want to show who is in a group. Creating a personal connection with the recipient, improved one-on-one communication, serving as a fantastic marketing tool, and more are just a few additional advantages of employing the function.

Stock Market WhatsApp Group Links for June, 2023

Bull TraderClick to Join Group
NSE & MCX APR-18Click to Join Group
StockClick to Join Group
EQUITY AND MCX INTRADAYClick to Join Group
Zerodha new a/c openingClick to Join Group
Earn money groupClick to Join Group
Stock Cra ker 2Click to Join Group
200% తెలుగుgenuine stocksClick to Join Group
SHARE MARKET EARNINGSClick to Join Group
MCX & EQUITYClick to Join Group
UAE Buy and SellClick to Join Group
An intraday Trading ideaClick to Join Group
Blockchain Community IndiaClick to Join Group
MONEYClick to Join Group
STOCK ROLLERS -783Click to Join Group
Best BuyClick to Join Group
Stock MarketClick to Join Group
Trading PassionClick to Join Group
SharmaStocksClick to Join Group
MCX ExpertClick to Join Group
Investment GuruClick to Join Group
CRUDE ExpertClick to Join Group
Free Forex SignalsClick to Join Group
Group11 Stock MarketClick to Join Group
BrainStorm CommunityClick to Join Group
Daily StonksClick to Join Group
PFTSharing GroupClick to Join Group
EQUITY & FUTURES EXPERTClick to Join Group
Zerodha AccountsClick to Join Group
Nifty OptionsClick to Join Group
RAJ FINANCIALSClick to Join Group
DEMO BANK NIFTY 3DAYSClick to Join Group
ALPHA FOREXClick to Join Group
Forex mentorshipClick to Join Group
TRADER’S SPOTClick to Join Group
BrainStorm CommunityClick to Join Group
Group11 Stock MarketClick to Join Group
Sensex_BankniftyClick to Join Group
Loss recoverClick to Join Group
Option trading nightClick to Join Group
AdsexchangClick to Join Group
Stock Future Positional CallClick to Join Group
GromoClick to Join Group
Stock Market SchoolClick to Join Group
Learn Financial MarketClick to Join Group
The index pointsClick to Join Group
Stock Market TipsClick to Join Group
My StocksClick to Join Group
Stock Market earnClick to Join Group
AdsexchangClick to Join Group
Bank nifty and niftyClick to Join Group
The Stock Bull 2Click to Join Group

FOLLOW OUR WEBSITE FOR MORE INFORMATION: https://learningsharks.in/

FOLLOW OUR PAGE : https://www.instagram.com/learningsharks/

What is SEBI-Securities and Exchange Board of India In Stock Market?

On April 12, 1992, the SEBI Act 1992 established the Securities and Exchange Board of India (SEBI) as the controlling body for the Indian securities market.

SEBI on 12 April 1992 by the SEBI Act 1992
It was Introduced to promote transparency in the Indian Investment Market

What is SEBI?

In essence, SEBI is a statutory agency of the Indian government that was founded on April 12th, 1992. To encourage transparency in the Indian investment sector, it was introduced.

Along with its headquarters in Mumbai, the organisation has regional offices around the country in cities including New Delhi, Ahmedabad, Kolkata, and Chennai.

Who is the CEO of SEBI?

The head of India’s securities watchdog, the Securities and Exchange Board of India (SEBI), is Madhabi Puri Buch. She is not just SEBI’s first non-IAS chairperson but also its first female chairperson.

Objectives of SEBI

The task of policing the operation of the Indian capital market falls to SEBI. To protect investors’ interests, SEBI’s goals as a regulatory organisation include monitoring and controlling the Indian securities market.

By putting into place a number of rules and regulations and creating investment-related standards, it seeks to foster a safe investment environment.

Moreover, preventing fraud in the Indian stock market was one of the other primary goals.

Organizational Structure of SEBI

There is a corporate structure at SEBI India. Senior management, department heads, a board of directors, and numerous important departments are all present.

More specifically, the SEBI organisational structure consists of over 20 departments, each of which is managed by a department head who in turn is managed by a general hierarchy.

The nine specified officers who make up the hierarchical structure are as follows:

  • The Indian Union Government nominated the chairman.
  • Two representatives of the Indian Union Finance Ministry.
  • One RBI member, or Reserve Bank of India, member.
  • The Indian Union Government nominated the other five members.

Some of SEBI’s most important divisions are highlighted in the list below:

  • The department of information technology.
  • The Custodians and Foreign Portfolio Investors.
  • International Affairs Office.
  • A national securities market institute.
  • Department of Investment Management.
  • Department of Commodity and Derivative Market Regulation.
  • Human Resources Division

In addition to these, additional significant departments handle matters connected to law, finance, and enforcement.

Functions and Powers of SEBI

Being a regulatory organisation, SEBI has the authority to carry out essential duties. Such authority granted to the regulatory body is listed in the SEBI Act of 1992. As a result of its duties, SEBI acts as a financial intermediary, a defender of traders and investors, and an issuer of securities.

The suggestions below provide a quick overview of the subject.

Functions of SEBI

  • To safeguard Indian investors’ interests in the securities industry.
  • To encourage the growth and smooth operation of the securities market.
  • To control the securities market’s commercial activities.
  • Providing a platform for various professionals, such as portfolio managers, bankers, stockbrokers, investment advisers, merchant bankers, registrars, and share transfer agents.
  • To oversee the duties assigned to participants, including foreign portfolio investors, credit rating companies, custodians of assets, and depositors.
  • To inform investors about securities markets and the middlemen that operate inside them.
  • To outlaw unethical and dishonest business practises in the securities market and related areas.
  • To keep track of stock purchases and corporate takeovers.
  • To maintain the effectiveness and modernity of the securities market through appropriate research and development strategies.

Powers of SEBI

1. Quasi-Judicial Powers

SEBI India can make decisions in matters of fraud and unethical behaviour in the securities market.

The aforementioned SEBI authority supports the securities market’s transparency, accountability, and fairness.

2.Quasi-Executive Powers

The Book of Accounts and other important papers can be examined by SEBI to spot infractions or gather proof of them. The regulatory body has the authority to enforce rules, render verdicts, and pursue legal action against violators if it discovers someone breaking the rules.

3.Quasi-Legislative Powers

The authoritative body has been given the authority to create relevant rules and regulations in order to safeguard investors’ interests. These regulations frequently include listing requirements, insider trading restrictions, and crucial disclosure standards.

To stop fraud in the securities market, the body creates rules and regulations.

When it comes to the authority and duties of SEBI, the Supreme Court of India and the Securities Appellate Tribunal are in charge. The two supreme entities must do all necessary tasks and make all necessary judgements.

Advantages of SEBI

1. Short-term likelihood of increased returns

Investing in the stock market has the potential to generate larger inflation-beating returns in a shorter amount of time than other investment options like PPF and fixed deposits. People can considerably boost their chances of obtaining superior returns by adhering to the fundamentals of the stock market, such as preparing the trade and performing due diligence.

2. Purchased stock in the listed company and became a shareholder

No matter how few shares you purchase, the moment you do so, you gain proportionate control over the company’s shares.

3. Unparalleled liquidity

Comparing stock investing to other investment strategies, it provides a level of liquidity that is essentially unmatched. Investors can naturally decide fast whether to buy or sell a security. If someone needs access to money right away, they can always sell their shares and do so.

4. A regulatory agency that protects the interests of the public

The Securities and Exchange Board of India regulates and keeps an eye on the stock market. SEBI is charged with monitoring all developments and defending the interests of all parties. Once more, this goes a long way towards safeguarding their interests from any fraudulent action or business.

Disadvantages of SEBI

1. Volatility risks are rising

Due to how volatile and dynamic markets are, investing in shares has some risks. Share prices routinely go through peaks and valleys in a single day. Despite the low likelihood of a big failure, it might take years for the market to recover from a crisis’ worst consequences. These fluctuations are frequently unpredictable, which puts assets at risk.

2. The profit margins can be eroded by the brokerage

An investor must pay the broker a set percentage of the purchase price or sale price of each share they choose to buy or sell. Profitability could thus be put in danger.

FOLLOW OUR WEBSITE: https://learningsharks.in/

FOLLOW OUR PAGE: https://www.instagram.com/learningsharks/

Christmas Tree Spread with Puts Option Strategy

An advanced options strategy that has three legs and a total of six options is called a Christmas tree spread with puts. Buying one put at strike price D, bypassing strike price C, selling three puts at strike price B, and then buying two puts at strike price A are the steps in the option strategy. Similar to a butterfly spread, but with more room for the stock price to fall, making it a more bearish option strategy, the desired result is a pin at the short middle strikes.

Additionally, costs are higher compared to a typical butterfly spread since the long upper legged strike price is farther from the short middle strikes. The stock must decrease in price in order for the position to become profitable because it was opened at a higher cost. Losses are capped at the opening price in the event that the stock moves against the trader, even though the likelihood of a loss is higher.

Profit/Loss

The difference between the highest strike price and the three short middle put strike prices is used to determine the maximum profit, which is then subtracted from the trade’s cost. For instance, the maximum profit would be Rs 7.50 if the distance between point D and point B was Rs 10 and the deal cost Rs 2.50.

With the identical scenario, the maximum loss would be Rs 2.50 since the cost of the deal would be the maximum loss.

Breakeven

There are two points where things break even. By deducting the cost of the deal from the top strike price (point D), the upper breakeven point can be determined. Therefore, if trading cost Rs 2.50 and point D was an option with a strike price of 110, the upper breakeven would be Rs 107.50.

The lowest strike price (point A) plus one-half of the net debit would be used to determine the lower breakeven point. Therefore, if the cost of the trade was Rs 2.50 and the point A strike price was Rs 95 the lower breakeven would be Rs 96.25 (95 + 2.50 / 2).

Example

A trader might execute a 110/100/95 Christmas tree spread by purchasing one put with a strike price of 110, selling three puts with a strike price of 100, and purchasing two puts with a strike price of 95 for the following prices:

  • For Rs 8, purchase 1 XYZ 110-strike price put.
  • Sell three XYZ puts with a 100 strike price for Rs 6.90 (Rs 2.30 apiece).
  • Invest Rs 1.40 (Rs .70 per) to purchase two XYZ 95-strike price puts.
  • Total expense: Rs 2.50

The investor will have lost the whole Rs 2.50 and all holdings will be eliminated from his account if the stock increases in value over the ensuing three months.

The trader will profit Rs 10 on the market movement and the 110-strike price option if the stock goes down to Rs 100 at expiration, while the remaining options expire worthless. Their net profit would be Rs 7.50 because they spent Rs 2.50 to make the trade.

The investor would profit Rs 20 on the Rs 110 put if the stock fell to Rs 90. The short middle 100-puts lose Rs 10 X 3 for a total loss of Rs 30. Gain Rs 5 twice for a total of Rs 10 on the long lower 95-puts.

The investor paid Rs 2.50 for the trade, therefore their net loss is Rs 2.50. The final result would be Rs 20 – Rs 30 + Rs 10, meaning all profits are lost.

Conclusion

The more bearish a Christmas tree spread grows, while also lowering the cost of the deal, the lower a trader sets the strike prices. However, the likelihood of success decreases when strike prices are lowered.

The implied volatility is sensitive to variations in this kind of spread. Inversely correlated with changes in implied volatility is the spread’s net price, which decreases when implied volatility increases and rises when implied volatility decreases. The trader who places this order hopes implied volatility would decrease.

Only seasoned traders should implement a Christmas tree spread options strategy; it is not advised for beginners.

FOLLOW OUR WEBSITE FOR CHART PATTERNS: https://learningsharks.in/chart-patterns/

FOLLOW OUR PAGE: https://www.instagram.com/learningsharks/