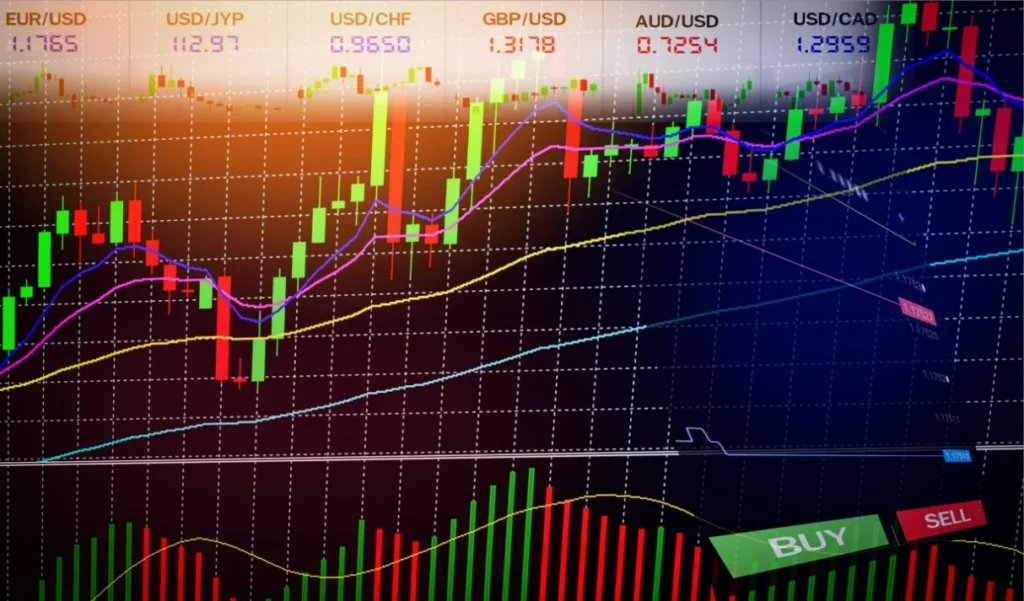
Since an indicator’s performance is influenced by a number of variables, including market conditions, trading technique, and personal preferences, there is no single “most powerful” Forex indicator. Forex traders employ a variety of indicators to aid in their analysis of the currency markets and decision-making. Several of the common indicators are:

- Moving Averages: Simple Moving Averages (SMA) and Exponential Moving Averages (EMA) are two types of moving averages that are frequently used to spot trends and possible entry or exit locations.
- Relative Strength Index (RSI): RSI can be used by traders to spot probable reversals by determining whether an asset is overbought or oversold.
- Moving Average Convergence Divergence (MACD): Moving Average Convergence Divergence (MACD) is a tool for spotting momentum shifts and potential trend reversals.
- Bollinger Bands: A middle band (SMA) and upper and lower bands that stand in for standard deviations make up a Bollinger Band. They can be used to spot price reversals and volatility.
- Fibonacci Retracement: Based on important Fibonacci ratios, Fibonacci retracement levels are utilised to determine probable support and resistance levels.
- Stochastic Oscillator: The stochastic oscillator aids traders in spotting overbought and oversold levels as well as possible reversals.
- Ichimoku Cloud: This indicator, known as the Ichimoku Cloud, offers a thorough analysis of support and resistance levels, trend direction, and momentum.
- Parabolic SAR: The parabolic SAR method aids traders in spotting probable trend reversals.
- Volume Indicators: Volume indicators can assist traders in determining the strength of a trend or potential reversals. One such indicator is On-Balance Volume (OBV).
- Williams%R: Williams%R, like the RSI, aids in determining overbought and oversold levels.
FOR MORE INFO CLICK THIS SITE:https://learningsharks.in/
FOLLOW OUR PAGE:https://www.instagram.com/learningsharks/?hl=en
