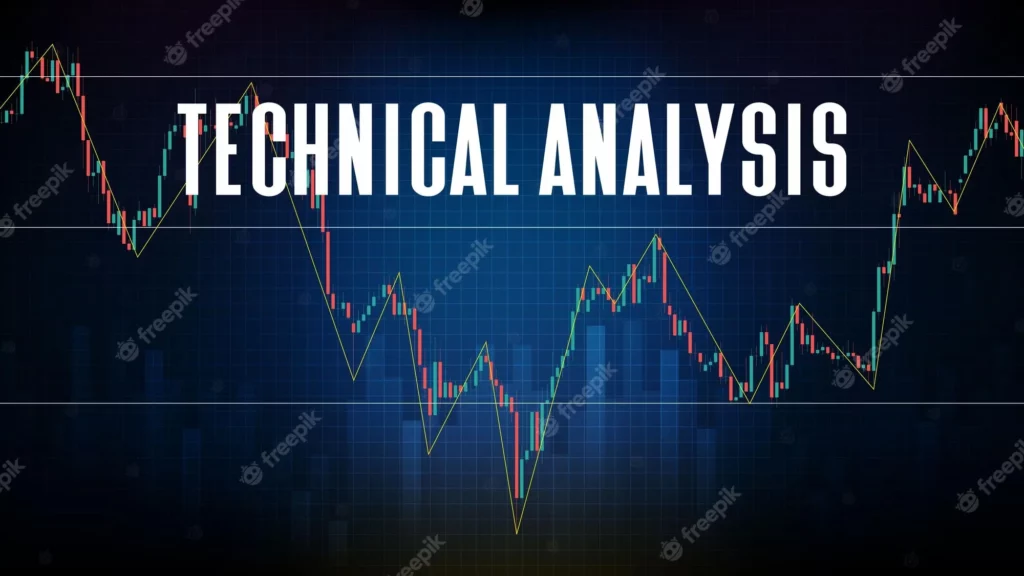
The study of historical market data, such as price and volume, is known as technical analysis. Technical analysts aim to predict future market behavior by using insights from market psychology, behavioral economics, and quantitative analysis. Chart patterns and technical (statistical) indicators are the two most common types of technical analysis.
KEY TAKEAWAYS
- Technical analysis attempts to forecast future price movements, giving traders the information they need to profit.
- Traders use technical analysis tools on charts to identify potential entry and exit points for trades.
- The market has processed all available information, which is reflected in the price chart, which is an underlying assumption of technical analysis.
The Power of Candlestick Patterns
Candlestick patterns are one of the most effective technical analysis tools. These patterns can help identify potential trend reversals or continuations and provide valuable insights into market sentiment. Let’s look at some of the most important candlestick patterns:
- Engulfing Bullish Pattern
When a small bearish candle is followed by a larger bullish candle that completely engulfs the previous candle’s range, the bullish engulfing pattern occurs. This pattern indicates a possible trend reversal from bearish to bullish and could indicate a buying opportunity. - Harami Bearish Pattern
When a large bullish candle is followed by a smaller bearish candle that is completely engulfed by the previous candle’s range, the bearish harami pattern is formed. This pattern suggests a possible trend reversal from bullish to bearish and may serve as a signal to sell or take profits. - The Doji Pattern
A candlestick pattern with a small body and long wicks on both ends is known as a doji. It represents market indecision and suggests that buyers and sellers are in equilibrium. A doji pattern can indicate a possible trend reversal, especially if it forms at critical support or resistance levels.
Trend Analysis and Moving Averages
Trend analysis is important in technical analysis because it helps traders determine the market’s direction. Moving averages are popular indicators for smoothing out price data and providing a more accurate picture of the underlying trend. Here are some examples of moving averages:
1. Simple Moving Average (SMA)
The simple moving average computes an asset’s average price over a given time period. The 50-day and 200-day moving averages are frequently used by traders to identify long-term trends. When the shorter-term moving average crosses above the longer-term moving average, a bullish signal is generated, indicating the possibility of an uptrend.
2. Exponential Moving Average (EMA)
The exponential moving average gives more weight to recent price data, making it more sensitive to market changes. Many traders prefer to use EMAs because they provide a more immediate indication of trend reversals. For short-term analysis, the 9-day and 21-day EMAs are commonly used.
Advantages of Technical Analysis:
- Technical analysis is based on unbiased information, such as price, volume, and historical trends. By doing this, trading decisions may be made without emotional bias.
- Any tradable asset with historical price data, including stocks, currencies, commodities, and virtual currencies, can benefit from the use of technical analysis.
- Timing: By giving traders tools for locating entry and exit points, it enables them to better time their trades.
- Focus on the Short Term: Technical analysis is ideal for traders who are interested in making short-term price movements into profits.
- Patterns and Trends: By allowing traders to spot different patterns and trends in price charts, which can act as helpful signals for potential price movements, traders can better predict future price movements.
- Risk management: Trading can be made easier by using technical analysis to help traders set stop-loss and take-profit levels.
- Market psychology: It takes into account the notion that market prices reflect the general psychology and emotions of traders, which can reveal information about the mood of the market.
Disadvantages of Technical Analysis:
- Subjectivity: Different traders may arrive at different conclusions from the same data due to the subjective nature of how chart patterns and indicators are interpreted.
- Technical analysis solely relies on historical data, which, particularly in markets that are undergoing rapid change, may not always accurately reflect future market conditions.
- Limited Fundamental Analysis: For long-term investors, fundamental information on company finances or macroeconomic trends can be very important. Technical analysis, however, largely ignores these issues.
- Subjectivity: Different traders may arrive at different conclusions from the same data due to the subjective nature of how chart patterns and indicators are interpreted.
- Black Swan Events: Unexpected events like economic crises or geopolitical shocks are difficult to predict or prepare for using technical analysis.
FOR MORE INFO CLICK THIS SITE:https://learningsharks.in/
FOLLOW OUR PAGE:https://www.instagram.com/learningsharks/?hl=en