BEST SELLING COURSE
About Technical Analysis Course
Technical Analysis is one of the most important parts of stock trading. It refers to the prediction of anticipated price swings given past charts. Although. Technical analysis is frequently referred to as the "backbone" of stock market trading. It's for individuals who are just getting their feet wet in the world of charts and technical analysis.
Language: English & Hindi I Time Duration: 4 Weeks (45% Increased) I Fees:35,000
Every trader who employs technical analysis was once completely unfamiliar with everything. There is information available on various websites that should be utilized, but it is critical that we stay organized so that we do not become overwhelmed, and that we are able to direct our focus and knowledge to understand what is most necessary and apply it.
In addition, Technical analysis, as opposed to fundamental analysis, focuses on the examination of price and volume. Besides, Fundamental analysis aims to estimate a security’s worth based on business performance such as sales and earnings.
Curriculum
- What is Technical analysis: We discuss the scope and nature of TA and how it can be used by a trader.
- Principles of Technical Analysis. We discuss the ground principles of TA keeping Dow Theory in mind.
- Types of Charts: Line, Bar, candlesticks and other charts that are used for TA.
- Importance of Technical Analysis
- Strengths and Weaknesses
- Difference between fundamental analysis and technical analyis.
Stock Market Trends: We define a trend and how to identify it. Also discuss Primary, secondary and minor trends.
Share Market Phases: We talk about Accumulation, Participation and Distribution.
Dow Theory Rules: discuss the rules and explain why they need to be followed.
Indian Share Market Structure: Identification of the markets whether they are trending or rangebound.
Best Chart Patterns: Identification of significant patterns within the market structure and how they can be interpreted by locating support and resistance zones.
Double Tops and bottoms
Head and Shoulders, straight and inverted
Cup and Handle, straight and inverted
Triangle, ascending and descending
Wedge, rising and falling
Flag
Support Equals Resistance: Explain the psychology behind S&R and why it happens.
Trendlines: How to draw them on the charts and what it can do for a trader.
- Bullish Vs. Bearish: We explain how a candlestick is made.
- Conventional Candlestick Patterns
- Doji bullish and bearish
- Hammer
- Hanging Man
- Shooting Star
- Spinning tops
- Marubozu bullish and bearish
- Engulfing bullish and bearish
- Harami bullish and bearish
- Piercing bullish and bearish
- Dark Cloud Cover
- Tweezer tops and bottoms
- Morning and Evening Star
- Three white soldiers
- Three black crows
- Falling and Rising Three
- Boring Vs. Explosive Vs. Rejection Candlesticks: Simplifying the candlestick patterns.
- The Psychology behind: Preparing to use simplified candlestick patterns to understand price action.
What are Indicators and Oscillators: Definition and how they can be used.
Scope of Indicators and Oscillators: strengths and weaknesses and correct interpretation.
Types of Indicators and Oscillators that will be discussed:
Moving Averages
Bollinger Bands
Parabolic SAR
VWAP
Fibonacci Retracements and Extensions
MACD
RSI
ADX
ATR
- What is Price Action: We define price action and explain how it can be used for maximum profit and minimum loss.
- Candlesticks Reengineered: Using simplified candlestick patterns to find trade entries and exits.
- S&R Reengineered: Observing Support and resistance as demand and supply zones.
- Timeframes: To understand the location in terms of where the trend is by toggling through multiple timeframes. Like zooming in and out of a map.
- RISK TO REWARD: How much should a trader risk for how much profit
- Trade management: How can a trader scale their positions during a trade
- Read the charts to find possible opportunities.
- Find signal on lower time frame
- Apply entry and exit strategies
- Finding confluence with indicators

Click here to learn for free from the knowledge base
Learning Outcomes
- Explain technical analysis principles and assumptions while Making a living off of active trading
- Explain how technical analysis and behavioural finance along with Putting together a self-trading method
- Compare and contrast technical and fundamental analysis principles; During intraday trading and positional trades.
- Several forms of technical analysis charts; describe and interpret them while understand the psychology of ordinary investors and traders when it comes to market activity
- Define the terms “trend,” “support,” and “resistance” lines; the most typical chart layouts, indicators and Techniques for analysing data with a high likelihood
- Examine the price movement while putting stop losses and setting Targets.
Meanwhile, Let us give you some theoretical knowledge
Awesome Technical analysis methods are used to examine how variations in price, volume, and implied volatility are affected by supply and demand for securities.
Furthermore, It is based on the concept that when combined with appropriate investing or trading rules, past trading activity and price fluctuations of security can be useful indications of the security’s future price movements.
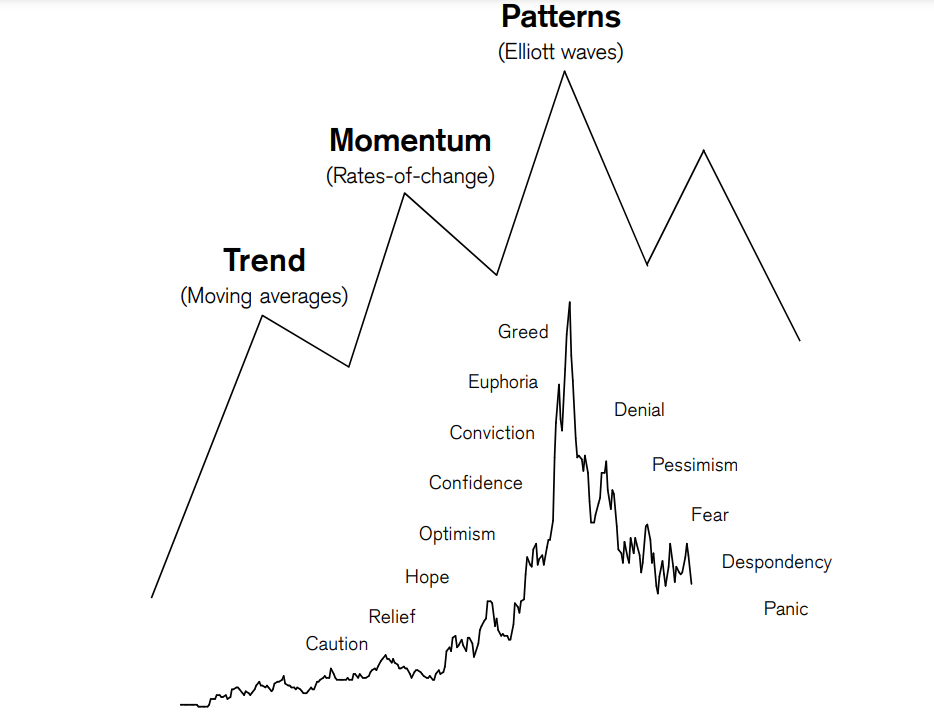
“Technical analysis is the analysis of human mass psychology. Therefore, it is also called behavioural finance.”
It’s commonly used to generate short-term trading signals from various charting tools, but it may also aid with assessing a security’s strength or weakness in relation to the larger market or one of its sectors. This data aids analysts in bettering their overall valuation estimate.
The Technical analysis is frequently used in conjunction with other types of study by professional analysts. While retail traders may make conclusions entirely based on a security’s price charts and other statistics, professional stock analysts rarely limit their research to fundamental or technical analysis.
Any security with previous trading data can be subjected to technical analysis. Stocks, futures, commodities, fixed-income, currencies, and other securities fall under this category. Technical analysis is far more common in commodities and FX markets, where traders are more concerned with short-term price swings.
Conversely, Technical analysis aims to predict the price movement of nearly any tradable instrument subject to supply and demand pressures, such as stocks, bonds, futures, and currency pairs. In fact, some people consider technical analysis to be nothing more than the study of supply and demand forces as represented in a security’s market price movements.
Although price fluctuations are the most typical focus of technical analysis, some analysts examine other metrics as well, such as trade volume or open interest.
Hundreds of patterns and signals have been generated by researchers to enhance technical analysis trading across the sector.
In order to foresee and trade market fluctuations, technical analysts have devised a variety of trading strategies.
Some indicators are primarily concerned with identifying the current market trend, such as support and resistance levels, whilst others are concerned with determining the strength of a trend and its chances of continuation. Trendlines, channels, moving averages, and momentum indicators are some of the most commonly utilised technical indicators and charting patterns.
- Price trends
- Chart patterns
- Volume and momentum indicators
- Oscillators
- Moving averages
- Support and resistance levels
The two major schools of thinking when it comes to approaching the markets, fundamental analysis and technical analysis, are on different ends of the spectrum. Both strategies are used to analyse and estimate future stock price patterns, and they, like every investment strategy or philosophy, have supporters and detractors.
Fundamental analysis is a method of appraising securities that aims to determine a stock’s inherent worth.
Fundamental analysts look at everything from the overall economy and industry conditions to a company’s financial situation and management.
Fundamental analysts pay close attention to earnings, expenses, assets, and liabilities.
Technical analysis varies from fundamental analysis in that the only inputs are the stock’s price and volume.
The essential premise is that all known principles are equal.
All known fundamentals are taken into price, so there’s no need to pay attention to them.
Technical analysts don’t try to calculate a stock’s intrinsic worth; instead, they utilise stock charts to spot patterns and trends that can predict how a stock will perform in the future.
History repeats
Technical analysts believe that price trends in the past tend to repeat themselves over time. So they sit down with previous stock charts, examine price and volume data, and then try to predict how the stock’s price will move in the future utilising trends. As a result, they select equities that they believe will gain in value and sell those that they believe will decline.
Mathematical approach
To identify stocks, technical analysts use probability. They can forecast the outcome of an action using probability without having to examine it in great depth.
As a result, technical analysis tells you how prices will fluctuate without you having to worry about the nitty-gritty details that will cause the price to move. Fundamental analysis is significantly slower and more time-consuming.
A huge drop in stock prices is sometimes right around the bend, but no one sees it coming. It is impossible to forecast using fundamental analysis tools. However, the fall can be predicted using previous chart patterns and other analytical methods.
Of course, Technical analysis cannot tell you why the market is falling, but it may tell you when it is likely to fall. You can get ready for it by doing so.
SHORT-TERM TREND IDENTIFICATION:
Fundamental analysis is more important for investors who plan to invest for three to five years or more. This is due to the fact that every lucrative business strategy requires time to develop.
As a result, investors must also be patient. With technical analysis, however, this is not the case. Ultimately, a stock’s performance is determined by the company’s profitability. Technical analysis will not be able to forecast this. It can only predict whether the stock will rise or fall in the near future.
Price charts are analysed by technical traders in order to forecast price movement. The time frames that are considered and the technical indicators that a trader decides to use are the two most important elements in technical analysis.
This analysis time frame on charts can range from one minute to monthly or even yearly time periods. The following are some of the most common time frames that technical analysts look at:
Chart for 5 minutes
Chart for 15 minutes
Hourly graph
4-hour graph
Chart for the day
The time frame that a trader study is usually defined by his or her own particular trading strategy. Intra-day traders like to analyse price movement on shorter time frame charts, such as the 5-minute or 15-minute charts because they initiate and terminate trading positions within a single trading day. Long-term traders who retain a position in the market
Fundamentals of technical analysis
We must presume that there is some relationship between historical chart patterns and future stock prices in order to use technical analysis to anticipate stock prices. This is the only way we can utilize historical data to anticipate future prices in a meaningful way. In the technical analysis of stocks, there are three basic assumptions.
Fundamental analysis, as previously said, is concerned with financial and other information about a stock. Technical analysis of stocks, while distinct from fundamental research, operates on the same principles.
If you’re a technical analyst, you feel that all investors are well-versed in a stock’s fundamentals. They actively utilise this data to make buying and selling choices.
Obviously, Best Technical analysis of stocks is based on the notion that each stock chart has its own distinct trend. Only within this trend do prices move. Finally, Every change in the stock price signals the following step. At this time, Let’s use the example of a ripple as an example.
When you toss a stone into a pond, you know that as soon as it strikes the water, it will create a series of ripples. The trend will fade in a few ripples. However, a similar ripple will appear the following time you throw a stone.
Similarly, you can recognise a pattern in stock charts based on previous experiences. Like waves, the movement in either direction may be larger or smaller than before. When you throw a larger or smaller stone, the ripples will also be greater or smaller. The pattern of these waves, on the other hand, will not change drastically.
Last but not least, a technical analysis is validated by the fact that trends repeat themselves. To put it another way, imagine a stock chart that follows the A-B-C pattern. So, every time we get to ‘C,’ we’ll start with ‘A,’ then move on to ‘B,’ and finally ‘C.’ Without fail, this pattern will repeat itself.
Only once you’ve made this assumption can you use technical analysis to forecast future stock prices. Without this premise, simply glancing at a chart will not reveal where the price will move next.
Pros and cons of technical analysis
pros
Also, The ability to recognise price trend cues in a market is an important part of any trading strategy. All traders must devise a system for determining the optimal entry and exit points in a market, and technical analysis tools are a popular approach to do so.
However, Technical analysis software is now so widely utilised that many people believe it has established self-fulfilling trading rules: More buyers and sellers will congregate around the same price points as more traders use the same indicators to discover support and resistance levels, and the patterns will surely recur.
Cons
Obviously, There will always be an element of unpredictability in market behaviour. Any type of analysis, whether technical or fundamental, cannot be guaranteed to be 100 per cent accurate. While, previous price patterns can provide insight into an asset’s anticipated price trajectory, they do not guarantee success.
However, To acquire the maximum level of assurance possible, traders should use a variety of indicators and analysis tools, as well as having a risk management strategy in place to defend against unfavourable moves.
Who can take technical analysis course?
Beginners, intermediates and professionals, Investors and full-time traders, Shareholders, Retails traders, Sub brokers and brokers, Operation managers, Portfolio managers and other financial service providers
Other courses
Mutual funds
FAQ
This course focuses on learning and comprehending trading patterns, trading methods, trading psychology, money-making approaches, and how to forecast future moves using previous trend data.
The easiest way to learn technical analysis is to first master the fundamentals and then apply what you’ve learned through backtesting or paper trading. Many brokers and websites now offer electronic platforms that enable simulated trading that resembles live markets, thanks to today’s technology.
- Markets alternate between range expansion and range contraction. …
- Trend continuation is more likely than reversal. …
- Trends end in one of two ways: climax or rollover. …
- Momentum precedes price.
- GAUTAM SHAH.
- ASHWANI GUJRAL.
- SUDARSHAN SUKHANI. A full time trader and developer of technical analysis software. …
- ANANT ACHARYA. In 1981 at an age of 15 he was introduced to chess. …
- PRAKASH GABA.
National Institute of Securities Markets (NISM)
NSE’s Certifications in Financial Markets (NCFM)
Certified Equity Market Analyst (CEMA)
Certificate in Research, Trading and Advisory (CRTA)
- Process to register for NCFM.
- Photo Upload.
- Payment.
- Study Material.
- Enrollment.
- Taking the Test.
- Issue of Certificate.
Mastering the art of technical analysis will boost your profits and prevent you from making costly financial mistakes. Technical analysis makes it simple to determine the market’s overall trend (Up Trend/Down Trend/Range Bound). You can do so by looking at the Nifty Yearly/Monthly/Weekly chart.
Undoubtedly, learning sharks institute works hard to maintain this list of share market Training courses up to date. However, In the event of a dispute between the programmes mentioned in the Learning sharks Academic Calendar and this list, the Calendar will take precedence nevertheless.
In addition, Please contact the Enrollment Desk if you have any further questions about admissions or programme offerings. Nevertheless, Please contact us at feedback@learninghsharks.in to edit a programme listing. Alternatively, you can reach us directly for any course queries. On the contrary, one can call our number 8595071711.
Even so, we launch new stock market integrated trading programmes every 6 months. In spite of stock market trends and conditions. While we have you here. Of course, we do not want to miss asking you to share a review. Clearly, It is necessary and appreciated. our Trading community has been growing evidently. Surely, the credit goes to our mentors and our hard-working trading students.
For this reason, we keep coming out with discounts and concessions on our programmes. Besides, We believe each citizen has the right to learn about the market.
Because we believe each student should be successful. Since our program is so powerful. So, we encourage and invite more applications, therefore. Of course, we feel proud to invite the differently abled students too. Moreover, the stock market does not care about any race, religion, family background or religion also. Then, again, We are there to assist you with the best education. Finally, head over to our contact page to speak to our counsellor. For one thing, we do not want our students to fail, which is why give regular and repeated classes too.